


Prometheus and Nagios are superhero guardians for your computer systems, networks, and applications, created by tech-savvy folks from SoundCloud and Ethan Galstad.
Imagine Prometheus as the superhero who likes to pull in metrics, thanks to its dynamic service discovery magic. It’s perfect for monitoring the availability and performance of modern, cloud-native setups and even making friends with Kubernetes and other containerization apps.
Now, meet Nagios, the hero with a push-based approach. It uses a bunch of plugins to keep things in check. It’s your go-to for more traditional IT setups, offering a rich library of plugins and flexing its muscles with complex configurations.
In our epic showdown, we’ll compare them on crucial factors like deployment, installation, data model, metrics collection, service discovery, scalability, visualization, and alerting capabilities. It’s the ultimate face-off to guide developers on their monitoring journey. Get ready for the battle of the monitoring superheroes!
Prometheus
Prometheus is like the wizard of metrics, specializing in time series data. It’s the go-to choice for many R&D teams because it effortlessly blends into different software architectures, plays well with modern tech, and is a breeze to set up and maintain.
Picture This: Prometheus has its data storage wizardry, a special language called PromQL for navigating its multidimensional database, and a service discovery feature that’s like having a vigilant eye on every new component or service joining the application stack.
When there are services Prometheus can’t directly monitor, enter the Prometheus exporters—these collect data and identify them automatically. And for those crucial moments when thresholds are breached, Prometheus Alertmanager steps in, sending notifications to external tools for collaboration or the on-call heroes.
Check out Figure 1 for a sneak peek at Prometheus’s architecture (Source: Prometheus).
Now, let’s talk about Prometheus users’ favorite sidekick – Grafana. Why? Let’s be honest: Prometheus’s user interface is a bit basic. Grafana’s dashboards and graphs come to the rescue, letting you query and display Prometheus metrics and mix and match them with data from other sources.
Top 10 Steps Deploying Prometheus for Your System
Step 1: Prepare for the Adventure
Before diving in, ensure your system meets the prerequisites and that you have the required permissions and access.
Step 2: Grab Prometheus
Go to the official Prometheus website or use your package manager to download Prometheus. Then, choose the version that best suits your system.
Step 3: Unpack the Treasure
Once Prometheus is in your possession, unpack the downloaded files to reveal the hidden gems.
Step 4: Configuration Quest
Navigate to the configuration file. Customize it according to your system’s unique landscape. Adjust settings, set targets, and let Prometheus know what to keep an eye on.
Step 5: Summon Prometheus
It’s time to summon Prometheus! Execute the command or script to start Prometheus on your system. Watch as it comes to life and starts collecting those valuable metrics.

Optimize Monitoring: Deploy Prometheus for advanced system monitoring capabilities.

Pooja Upadhyay
Director Of People Operations & Client Relations
Step 6: Seek Grafana (Optional)
Summon Grafana, Prometheus’ trusty sidekick, to enhance your Prometheus experience. Grafana’s visualizations will add a magical touch to your monitoring game.
Step 7: Explore and Define
Embark on a journey of exploration! Access Prometheus’s web interface to explore metrics and ensure everything aligns with your expectations. Tweak configurations and refine settings as needed.
Step 8: Automation Magic
Consider automating Prometheus deployments using tools like Ansible or Docker to make future deployments as magical as the first.
Step 9: Share the Wealth
Celebrate your success by sharing your Prometheus wisdom with your team. Documentation and knowledge-sharing ensure everyone benefits from this monitoring magic.
Step 10: Ongoing Quest
Monitoring is an ongoing quest. Regularly check in on Prometheus, adjust configurations, and stay vigilant to keep your system in its prime.
Nagios
Nagios, born in 1999, is the go-to open-source monitoring system for tracking computer systems, networks, and applications. Over the years, it has solidified its position as one of the most widely adopted tools in the industry.
Nagios diligently checks hosts and services like HTTP servers, email servers, and network devices to ensure optimal performance. It utilizes SNMP, NRPE, and plugins for these checks. Nagios promptly alerts users via email, SMS, or other methods when issues are detected.
The true strength of Nagios lies in its flexibility and extensibility. With a thriving community of users and developers, it boasts an extensive library of plugins. This diverse collection empowers Nagios to monitor various systems and services. The convenience of a web-based interface adds to its allure, facilitating easy management and monitoring from any location.
Nagios has earned its reputation as a robust and reliable monitoring tool. It is invaluable to IT departments and system administrators in efficiently overseeing complex IT infrastructure.
Top 10 Step Nagios Deployment
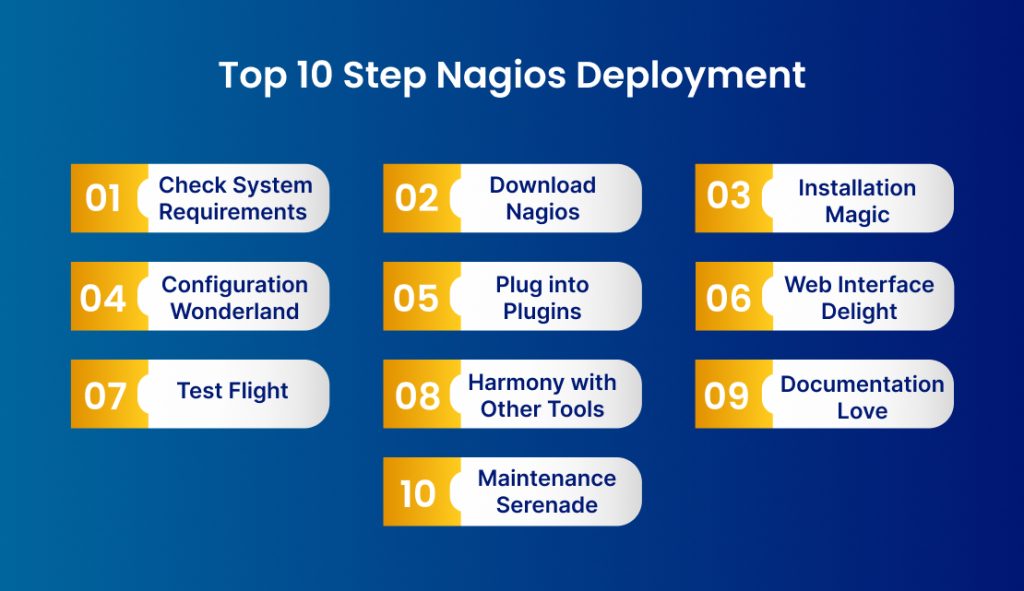
Deploying Nagios for your system monitoring needs is a straightforward process involving key steps. Here’s a user-friendly guide to help you get started:
1. Check System Requirements:
Before you begin, ensure your system meets the requirements for Nagios installation. This includes checking server specifications, operating system compatibility, and any dependencies.
2. Download Nagios:
Head to the official Nagios website and download the latest version. Choose the package that matches your operating system and architecture. The download page will guide you on whether you opt for the Core edition for basic monitoring or the XI edition for advanced features.
3. Installation Magic:
Follow the installation instructions provided for your specific operating system. This usually involves extracting downloaded files, configuring settings, and running installation commands. Watch for any prompts or configuration options that might pop up.
4. Configuration Wonderland:
Configuring Nagios is where the magic happens. Define the hosts, services, and commands you want Nagios to monitor. This includes specifying check intervals, notification settings, and other parameters. Nagios provides configuration files to customize settings to match your monitoring needs.
5. Plug into Plugins:
Explore Nagios plugins to extend its monitoring capabilities. Plugins allow Nagios to check specific services, applications, or devices. Install and configure relevant plugins based on what you want to monitor. This step adds extra power to your monitoring setup.
6. Web Interface Delight:
Nagios comes with a web-based interface for easy monitoring and management. Set up the web interface by configuring authentication, user accounts, and access controls. This step ensures secure access to Nagios features through a user-friendly interface.
7. Test Flight:
Before launching Nagios into your production environment, run some tests. Verify that hosts and services are being monitored as expected. Trigger test alerts to ensure notification systems are working smoothly. Tweak any configurations during this testing phase.
8. Harmony with Other Tools:
Integrate Nagios with other tools to create a seamless monitoring ecosystem. This might involve connecting Nagios to alerting systems, visualization tools, or logging platforms. Integration enhances the overall effectiveness of your monitoring setup.
9. Documentation Love:
Document your Nagios deployment. Jot down configurations, settings, and any customizations you make. This documentation will be handy for future tweaks, updates, or expansions to your monitoring setup.
10. Maintenance Serenade:
Keep Nagios up to date by regularly installing the latest updates, patches, and bug fixes. Periodically review and adjust your monitoring configurations based on changes in your IT environment.

Prometheus vs Nagios: Comparing the Tools
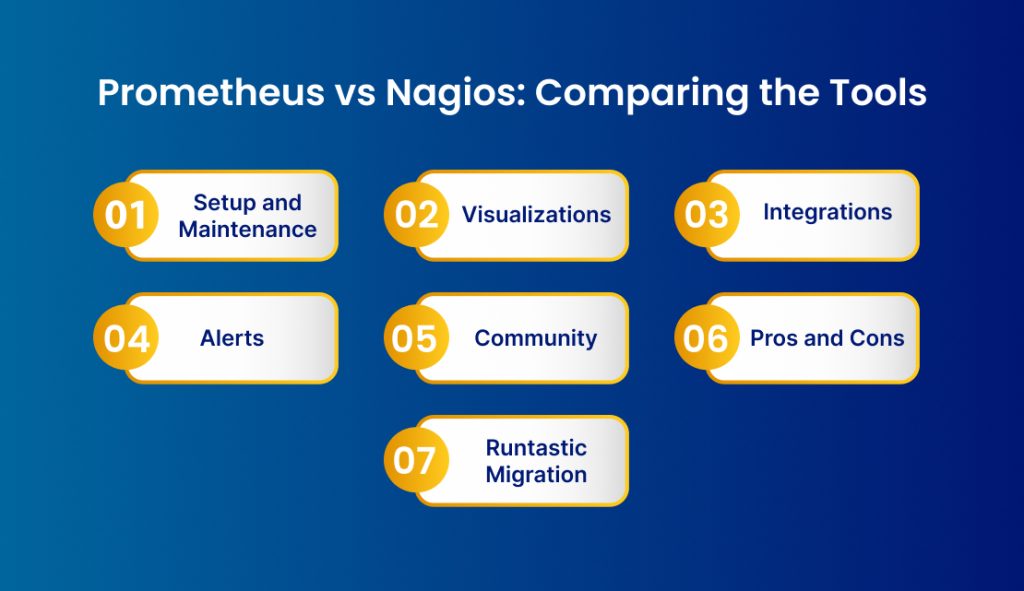
Setup and Maintenance:
Prometheus and Nagios are widely used open-source monitoring tools, but they differ significantly in design, features, and use cases. Let’s explore the key differences between them in a user-friendly way:
Abilities:
Prometheus and Nagios serve different functions. Nagios primarily focuses on monitoring application network traffic and security, while Prometheus emphasizes the application-centric aspects of the application and its infrastructure.
Prometheus collects data from applications using a pull model, where applications push metrics to their API endpoints or exporters. Conversely, Nagios uses agents installed on network elements and components, collecting data through a pull methodology.
Nagios can utilize Simple Network Management Protocol (SNMP) to communicate with network switches or components and the Windows Management Instrumentation (WMI) protocol for Windows-based tools.
Visualizations:
Prometheus provides graphs and dashboards, but users often use additional visualization tools like Grafana to display metrics effectively. Nagios has dashboards designed to monitor networks and infrastructure components but lacks graphs for more application-related issues.
Nagios requires initial configurations after downloading and installing the tool. Prometheus deployment is more straightforward, utilizing a Docker image that can spin up on various machine types. Maintenance involves storage upkeep and deploying exporters for non-instrumented services and tools.
Integrations:
Prometheus has extensive integrations with a long list of exporters, and users can write new exporters for integration with any tool. Nagios has a limited list of official integrations, including operating systems, MongoDB, Oracle, Selenium, and VMware.
Alerts:
Prometheus offers Alertmanager for setting thresholds and pushing alerts. Nagios uses various channels for alerts, such as email, SMS, and audio alerts. It can even generate WinPopup messages with alert details.
Community:
Prometheus has a large and active community with numerous contributors, forks, and watchers on GitHub. Nagios Core has a smaller community, fewer contributors, and less frequent updates.
Pros and Cons:
Prometheus excels in integrability and ease of use but faces challenges with main scaling. Solutions like Thanos can address scaling issues but require additional work. Nagios boasts scalability, simplicity in maintenance, and high customizability, making it suitable for various applications and network infrastructures.
Runtastic Migration:
Runtastic migrated from Nagios to Prometheus due to Nagios’ high configuration effort and generation of false positive alerts.
Summary
Comparing Prometheus to Nagios is like putting the neighborhood’s most popular guy against someone who stands out in their group. These tools differ in design, audience, and capabilities.
Prometheus is your go-to for monitoring app functionality, while Nagios shines as a robust platform for application networks and security. When it comes to performance metrics, Prometheus takes the lead. However, since they play distinct roles in DevOps monitoring stacks, each provides only a part of the application status picture. Integrating both tools could be a smart move.
Prometheus and Nagios empower DevOps consultants to monitor real-time app status, ensuring quick reactions when needed.
Empower Your Development with Expert Guidance. Schedule Your DevOps Consultation Now!
Pooja Upadhyay
Director Of People Operations & Client Relations
