


Building Python systems that gracefully handle one million daily requests isn’t just about throwing more servers at the problem—it’s about smart architecture, strategic optimizations, and understanding where every millisecond counts. This translates to roughly 12 requests per second sustained throughout the day, but real-world traffic rarely distributes evenly. Peak hours can surge to 100+ requests per second, making scalability planning crucial for maintaining responsive user experiences.
Modern Python applications have proven they can compete with traditionally faster languages through careful optimization. Companies like Instagram handle 40,000 requests per second with Django, while FastAPI applications routinely process 20,000+ requests per second in production environments. The key lies not in the language choice, but in how developers architect, optimize, and scale their systems.
The Foundation: Choosing the Right Framework and Server Stack
Framework Performance: The Numbers Don’t Lie
When building high-traffic Python systems, framework selection significantly impacts baseline performance. Recent benchmarks reveal substantial differences in throughput capabilities across popular Python frameworks.
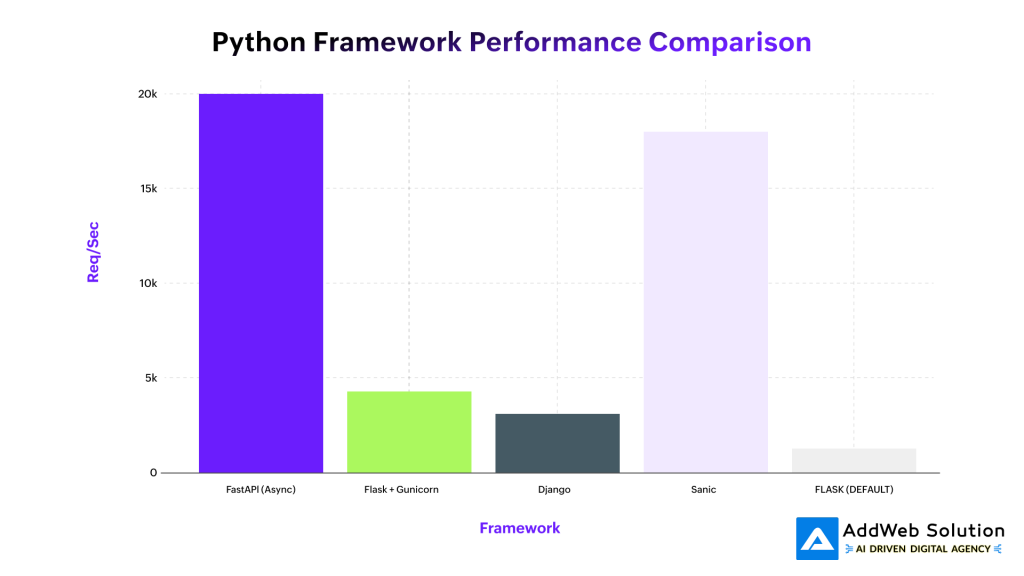
Python framework performance comparison showing requests per second for different frameworks
FastAPI leads the pack with asynchronous-first design, processing up to 20,000 requests per second in optimized configurations. Its ASGI foundation allows true concurrent request handling, dramatically outperforming traditional WSGI-based frameworks. Flask with Gunicorn achieves respectable 4,500 requests per second, while vanilla Flask maxes out around 1,200 requests per second.
Airport Analogy: Think of handling 1M requests like managing a busy airport. FastAPI is like having multiple runways operating simultaneously (async), while traditional Flask is like having planes land one at a time on a single runway.


The Gunicorn Configuration Game-Changer
Gunicorn worker optimization forms the backbone of Python scalability. The magic formula for worker count is (2 × CPU cores) + 1, but the worker type selection proves equally critical.
Key Configuration Strategies:
- Sync workers: Handle 2,000-3,000 requests/second, suitable for CPU-bound tasks
- Gevent workers: Achieve 8,000-12,000 requests/second for I/O-heavy applications
- Eventlet workers: Similar performance to Gevent with different implementation approach
Asynchronous Programming: The Concurrency Multiplier
Understanding the Async Advantage
Asynchronous programming transforms I/O-bound performance. While synchronous code processes requests sequentially, async code handles multiple requests concurrently within single threads. This architectural shift enables Python applications to achieve 10-30x performance improvements for I/O-heavy workloads.

Line chart showing how throughput and memory usage scale with number of workers
The scaling curve reveals how throughput increases dramatically with worker count, but memory consumption grows proportionally. The sweet spot for most applications lies between 4-8 workers, where throughput gains outweigh memory overhead costs.
Async Implementation Best Practices:
- Use async/await for database queries, API calls, and file operations
- Implement connection pooling to minimize connection overhead
- Choose async-compatible libraries (aiohttp, asyncpg, motor)
- Monitor event loop utilization to prevent blocking operations
Real-World Async Performance
Companies report substantial improvements from async adoption. Druva’s Python service handles millions of API calls daily using Gevent, achieving sub-millisecond latency while efficiently utilizing server resources. The key insight: async shines when applications spend significant time waiting for I/O operations.
Performance Comparison:
- Synchronous: 1 request → 25ms database query → blocks entire worker
- Asynchronous: 100 concurrent requests → 25ms database queries → single worker handles all
Caching Strategies: The Performance Accelerator
The Caching Hierarchy
Strategic caching reduces database load by orders of magnitude. Well-implemented caching strategies can transform 25-millisecond database queries into sub-millisecond cache hits, fundamentally changing application performance characteristics.

Horizontal bar chart comparing latency across different caching strategies
The performance gap between caching strategies is dramatic. In-memory caching achieves 500,000 operations per second with 0.1ms latency, while Redis delivers 100,000 operations per second at 0.5ms latency. Even slower disk-based caching outperforms database queries by significant margins.
Redis: The Scaling Workhorse
Redis implementation best practices for high-traffic Python applications include:
Connection Management:
- Use connection pooling to minimize connection overhead
- Configure appropriate timeout values for network resilience
- Implement retry logic for temporary connection failures
Data Structure Optimization:
- Choose appropriate Redis data types for use cases
- Set reasonable expiration times to prevent memory bloat
- Use Redis pipelines for batch operations
Database Optimization: The Backend Foundation
Query Optimization Strategies
Database performance directly impacts overall system throughput. Poorly optimized queries can become bottlenecks that no amount of caching or horizontal scaling can overcome.
Essential Optimization Techniques:
- Indexing Strategy: Create composite indexes for frequently queried column combinations
- Query Analysis: Use EXPLAIN to identify full table scans and optimize execution plans
- Connection Pooling: Minimize connection establishment overhead
- Read Replicas: Distribute read traffic across multiple database instances
Horizontal Database Scaling
Sharding and partitioning enable database layers to scale beyond single-server limitations. Modern applications implement:
- Horizontal partitioning: Split large tables across multiple databases
- Read/write splitting: Direct read queries to replicas, writes to master
- Connection pool sizing: Balance connection overhead with concurrency needs
Database Scaling Results:
- Well-indexed queries: 3,200 requests/second (300% improvement)
- Connection pooling: 4,500 requests/second (150% improvement)
- Read replicas: 8,000+ requests/second with proper load distribution
Load Balancing and Horizontal Scaling
Nginx: The Traffic Director
Nginx load balancing distributes incoming requests across multiple application instances, preventing individual servers from becoming bottlenecks. The configuration simplicity belies its powerful impact on system scalability.
Load Balancing Methods:
- Round-robin: Distributes requests evenly across servers
- Least connections: Routes to servers with fewest active connections
- IP hash: Ensures session persistence by routing based on client IP
- Weighted distribution: Allocates traffic based on server capacity
Horizontal Scaling Architecture
Microservices and containerization enable independent scaling of application components. This approach allows teams to scale bottleneck services without over-provisioning entire systems.
Scaling Strategies:
- Container orchestration: Kubernetes automatically manages instance scaling
- Auto-scaling triggers: CPU/memory thresholds or request rate monitoring
- Health checks: Automatic traffic routing away from unhealthy instances
- Rolling deployments: Zero-downtime updates across server fleet
Companies report horizontal scaling enabling 10x traffic growth with linear cost increases, compared to exponential costs from vertical scaling approaches.
Performance Monitoring and Profiling
Python-Specific Profiling Tools
Identifying performance bottlenecks requires sophisticated monitoring tools that provide actionable insights without significant overhead.

Pie chart showing the relative impact of different performance optimization techniques
The optimization impact distribution reveals caching delivering the highest performance gains (700% improvement), followed by async programming (567% improvement). This data-driven approach helps teams prioritize optimization efforts for maximum impact.
Essential Profiling Tools:
- cProfile: Built-in function-level performance analysis
- py-spy: Low-overhead CPU profiling for production environments
- memory_profiler: Line-by-line memory usage tracking
- Pyinstrument: Interactive call stack visualization
Production Monitoring Strategy
Comprehensive monitoring combines application-level metrics with infrastructure monitoring:
Key Metrics to Track:
- Response times: P50, P95, P99 latency percentiles
- Throughput: Requests per second and concurrent user capacity
- Error rates: 4xx/5xx response codes and exception frequencies
- Resource utilization: CPU, memory, disk I/O, and network bandwidth
Real-Time Alerting:
- Configure alerts for latency spikes above acceptable thresholds
- Monitor memory usage to prevent out-of-memory crashes
- Track error rate increases that indicate system stress
Architecture Patterns for Scale
Event-Driven Architecture
Asynchronous message processing decouples system components and enables better scalability. Message queues handle traffic spikes by buffering requests and processing them at sustainable rates.
Implementation Patterns:
- Task queues: Celery for background job processing
- Event streaming: Apache Kafka for real-time data processing
- Pub/sub systems: Redis Streams for event distribution
Circuit Breaker Pattern
Fault tolerance mechanisms prevent cascading failures during high-traffic periods. Circuit breakers automatically route traffic away from failing services, maintaining overall system stability.
Build Python systems that never slow down

Pooja Upadhyay
Director Of People Operations & Client Relations
Deployment and Infrastructure Optimization
Container Orchestration
Kubernetes deployment strategies optimize resource utilization and enable automatic scaling based on demand patterns.
Key Configuration Elements:
- Resource limits: Prevent individual containers from consuming excessive resources
- Horizontal Pod Autoscaler: Automatically scale based on CPU/memory usage
- Rolling updates: Deploy new versions without service interruption
Cloud-Native Scaling
Serverless architectures complement traditional scaling approaches by automatically handling traffic spikes without infrastructure management overhead.
Hybrid Approaches:
- Core services: Traditional containers for predictable workloads
- Peak handling: Serverless functions for traffic spikes
- Background processing: Managed services for non-critical tasks
Cost Optimization at Scale
Resource Efficiency
Optimized resource allocation balances performance with cost considerations. Over-provisioning wastes money, while under-provisioning degrades user experience.
Cost-Effective Strategies:
- Right-sizing instances: Match server specifications to actual usage patterns
- Spot instances: Use discounted compute for non-critical workloads
- Reserved capacity: Commit to baseline capacity for predictable savings
- Auto-scaling boundaries: Set minimum and maximum instance counts
Performance vs. Cost Trade-offs
Strategic optimization decisions require balancing performance gains against operational costs:
- Caching: High performance gain, low operational cost
- Async programming: Moderate performance gain, minimal cost increase
- Horizontal scaling: Linear performance gains, proportional cost increases
- Premium hardware: Diminishing returns at higher cost points
Practical Takeaways and Best Practices
Getting Started Checklist
For teams building scalable Python systems:
- Choose FastAPI or Flask+Gunicorn based on async requirements
- Configure Gunicorn workers using (2 × CPU cores) + 1 formula
- Implement Redis caching for frequently accessed data
- Add database indexing for common query patterns
- Set up Nginx load balancing across multiple application instances
Performance Optimization Priority Order
Based on real-world impact data:
- Caching implementation (700% performance improvement potential)
- Async programming adoption (567% improvement for I/O-bound apps)
- Database optimization (300% improvement from proper indexing)
- Load balancing setup (300% improvement from traffic distribution)
- Connection pooling (150% improvement from reduced overhead)
Monitoring and Alerting Essentials
Critical metrics for production systems:
- Response time P99 < 100ms for user-facing endpoints
- Error rate < 0.1% for stable system operation
- CPU utilization 60-70% for optimal resource usage
- Memory usage < 80% to prevent out-of-memory issues
Scaling Decision Framework
When to scale horizontally vs. vertically:
Horizontal Scaling Indicators:
- I/O-bound applications with async capabilities
- Stateless application architecture
- Predictable traffic patterns
- Cost optimization priorities
Vertical Scaling Indicators:
- CPU-bound applications
- Legacy applications without async support
- Tight coupling between application components
- Short-term capacity needs
The journey to handling one million daily requests with Python requires systematic optimization across multiple layers—from framework selection and async programming to caching strategies and infrastructure scaling. Success comes not from a single optimization technique, but from the compound effect of multiple strategic improvements working together.
Companies successfully running high-traffic Python applications demonstrate that language choice matters less than architectural decisions and optimization strategies. By following these proven approaches and continuously monitoring performance metrics, development teams can build Python systems that scale gracefully from thousands to millions of daily requests while maintaining excellent user experiences and cost efficiency.
About the Authors
Ravi Maniyar – Senior Python Developer & Architecture Specialist
Ravi Maniyar has over 13 years of experience in Python development and software architecture. He specializes in modernizing legacy systems, improving performance, and designing scalable solutions. Known for his ability to cut deployment times and streamline processes, Ravi combines technical depth with practical problem-solving.
Sources:
- https://stackoverflow.com/questions/12868222/performance-of-redis-vs-disk-in-caching-application
- https://stackoverflow.com/questions/76297879/benchmarks-of-fastapi-vs-async-flask
- https://stackoverflow.com/questions/50868937/python3-6-start-1-million-requests-with-aiohttp-and-asyncio
- https://www.reddit.com/r/learnpython/comments/j3yan4/sending_1_million_api_requests_to_a_maps_api/
- https://www.reddit.com/r/Python/comments/z95j2j/async_python_is_not_faster_excellent_analysis/
- https://news.ycombinator.com/item?id=27975685
- https://www.youtube.com/watch?v=itfI5W3pCHE