

Modern companies always look for ways to improve their strategic planning and decision-making process. Analysts and data engineers have become essential sources, transforming the raw data into valuable insights and supplying intelligence to help make informed decisions at the leadership level.
This vast field encompasses various applications that can be adapted to specific areas or uses. We all generate vast amounts of data annually, sometimes unaware of it. This includes everything from health records to social media activities, purchasing habits, and perhaps Netflix preferences. Analyzing this data can give companies a historical perspective, discover the how and “why” behind consumer trends, provide insight into the near future, and offer suggestions on the best direction.
It requires business acumen to discern which metrics provide the most valuable information. This article looks at eight kinds of data analytics and how data engineers can utilize them to help executives make better decisions.
What is Data Analytics?
If you’re interested in Real-Time Big Data Analytics and the various types of analysis using data, first, you must understand what the concept of ‘data analytics’ means. The process involves analyzing raw and scattered information from different sources to categorize and analyze data to answer business-related inquiries and identify patterns in the market.
Data analysis is a method to forecast trends and revenues. It informs businesses about which products sell best in which locations, what is popular with their intended customers, and much more. All this information can be utilized to help your business grow. Data science and analytics are indispensable in today’s business world. Data analytics isn’t the only thing. Data analytics can be divided into various kinds. If you want to learn more about the multiple types of data analytics, we’ve got the information you require in this post.
Importance of Data Analytics
Before discussing the four main kinds of data analytics and providing examples, it’s time to discuss why data analytics is essential for every company in 2022. Data analysis allows you to study and analyze massive quantities of data from different sources to identify patterns and trends and develop a decision that benefits the business. Through technology like automation and machine learning technologies, available today and in the future, it’s very simple, even for smaller businesses, to study a vast quantity of data. Data analysis has become essential to running a business into 2022. This is the reason why data analysis is necessary in the present:
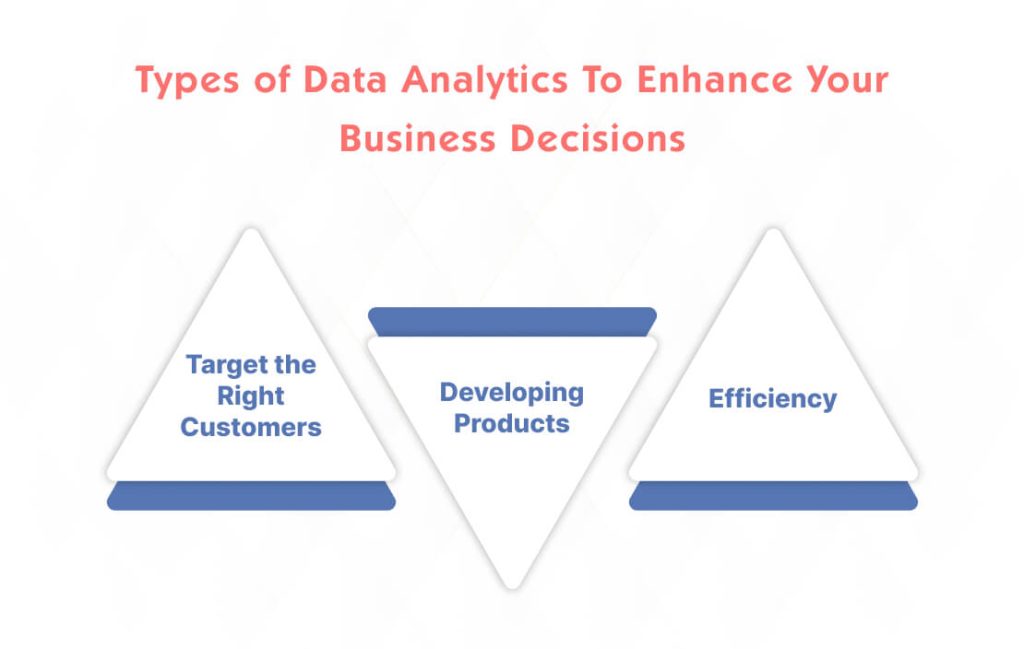
Target the Right Customers
In business, targeting the right customers through advertisements and marketing is essential. Data analytics will give you all the details about your customers’ demographics and what they value in the marketplace. This way, you can tailor your marketing strategy to better align with the people you want to reach. If they’re attracted to your product, they’ll purchase more, placing you ahead of your competitors.
Developing Products
Data analysis can provide businesses with critical insight into trends in the market and the development process. It also gives accurate forecasts of the future for which products will be well-known. This helps in defining the procedure for developing products. Companies should focus on products that perform well on the market instead of those that fail. This shift in focus can generate more revenue and better meet customers’ demands.
Efficiency
As we have seen in our discussion of the data types used in analytics for data, proper use of data analytics could enhance the performance of any business. Data analysis reveals what’s happened in the past and the reasons for this, but it can also reveal what is likely to happen shortly and what businesses can improve their performance. It provides a plan of action that could aid businesses in thriving. This is why improving efficiency is an essential purpose of data analytics. It is also why it’s such a vital element in any industry.

Make your data work at the right place with the right set of tools using our data analytics solutions.

Pooja Upadhyay
Director Of People Operations & Client Relations
Ways to Use Data Analytics
Data analytics are becoming increasingly vital every day. We’ve already discussed the reasons for its importance. It is time to examine how data science can boost a company’s efficiency. Remember that data science isn’t just limited to business. It can be applied to many other areas as well. This is why we have compiled a list of cases of using data science that could be applied in various places.
Delivery and Logistics
Many of the largest logistics and delivery firms worldwide employ data analysis to manage operations. They can find the most efficient delivery routes and predict when the package will be delivered based on findings derived from data analysis. They are also able to monitor packages across different channels. Data science has made online shopping more well-known.
Manufacturing
We have already discussed how data analysis could improve the product. Artificial Intelligence Development Company. In the same way, manufacturers can benefit from data analysis to create products for businesses. It aids in forecast analysis and budgeting to ensure that manufacturers produce the right amount of product and turn a profit.
Transportation
It is one of the fields in which data analytics is frequently used. Data analysis can aid in determining the best way to transport by analyzing traffic and network congestion data. It can plan alternative routes by studying vast amounts of data in a very short amount of time. Because of this, traffic accidents have been reduced dramatically.
Insurance
The insurance industry must collect information about IoT app development services, particularly about clients. It is difficult for insurance agents to keep every piece of information in their heads. With data analysis, insurance companies can review the clients’ data and determine how big of a risk they pose for insurance.
Education
Data analysis is crucial in education. It helps teachers know what students require. It is an excellent tool for adaptive content that aids students in learning quicker and more effectively. It is one way to improve education.
Data science can also be utilized in many other fields, such as security, healthcare travel, the military, etc.
Techniques of Data Analytics
Here are some methods for data analysis:
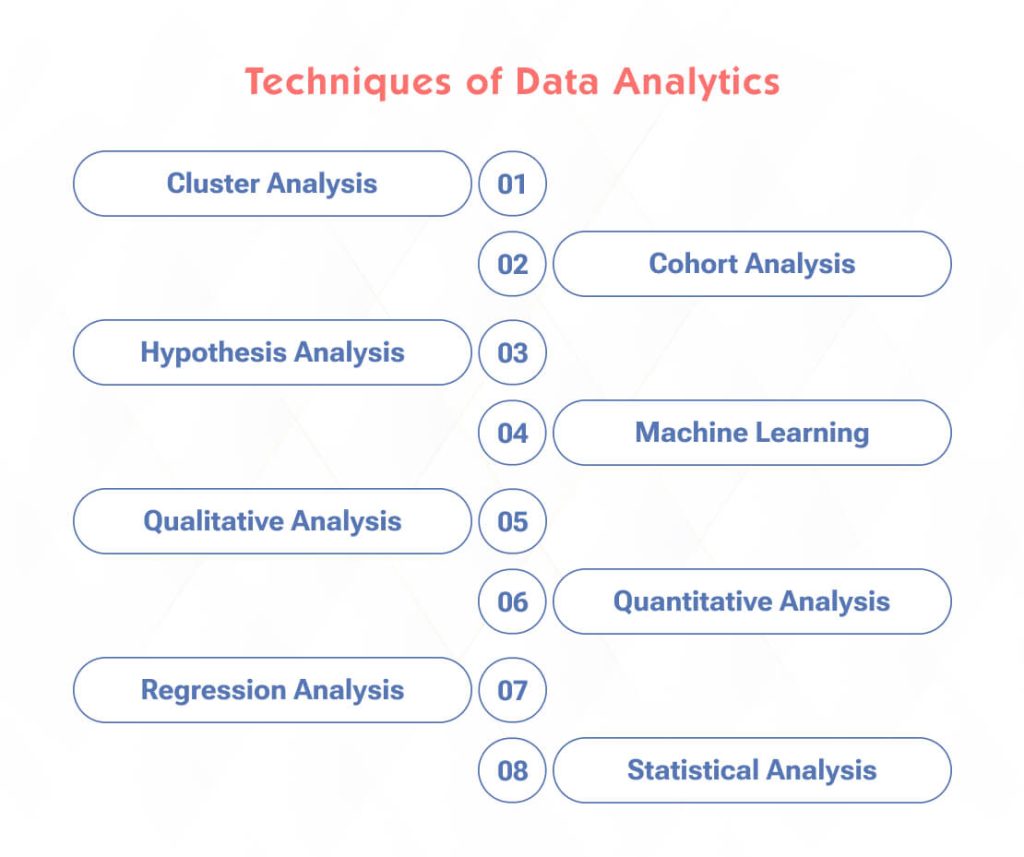
Cluster Analysis
Cluster analysis uncovers relationships between data to create information clusters of related data items. These clusters reveal the distribution of data between various types of data. You can use this marketing analysis to find customer demographics and target sales areas.
Cohort Analysis
The Cohort Analysis is similar to the process of clustering data. It involves forecasting how these clusters or cohorts perform. It’s used to predict the purchasing patterns by cohorts to determine the frequency at which customer groups buy a product or service from a business. These patterns will reveal what specific features draw and retain customers.
Hypothesis Analysis
Hypothesis analysis evaluates your company’s performance expectations by examining two variables to discover connections. If you can establish a cause-and-effect hypothesis, these two elements are the ones to assess. The analysis determines whether there is a link between them to achieve an effective cause-and-effect model.
Machine Learning
Machine learning is the application of programs and software to make predictions based on the specifications set by the person using them. Machine learning can automate much of the data input and analysis process by learning how a user collects and evaluates data. Users can also set limits or preferences within this program to guarantee it produces accurate analysis reports.
Qualitative Analysis
Qualitative analysis examines textual information and observations to discover the strengths of products and services. Analyzing product or company reviews quantitatively is also possible, using different terms and phrases commonly categorized as cons and pros. This allows the business to assess public opinion and get direct feedback.
Quantitative Analysis
Quantitative analysis utilizes numbers to produce databases for comparisons and predictions. Analysts can conclude by compiling quantitative responses to polls, surveys, and other measurement-based media. Combining these quantitative analyses with financial data for investment predictions or product pricing is possible.
Regression Analysis
Regression analysis helps predict future trends by identifying relationships between dependent and independent variables. Businesses can use regression analysis to determine how different independent variables, such as marketing and social media, could affect the sales-dependent variable. This analysis may establish positive relationships between variables, allowing an organization to discover the factors influencing its sales.
Statistical Analysis
Statistics involves gathering quantitative data and utilizing descriptive analytics to summarise the data to formulate a hypothesis. You can then use the hypothesis analysis to validate and analyze the results. Statistical analysis is used for research involving a group sample, which can be applied to a broader population.

Four Types of Data Analytics for Business to Enhance Decision-Making
We all know the importance of data analytics services as a vital element of modern business, which can increase profits and enhance customer experience. However, the method used to analyze data determines its role in business and the areas in which it will be utilized.
Let’s examine the fundamental question, “What kinds of data analytics can be classified into?” Four types of data analytics must be mastered: diagnostic, Descriptive, Predictive, and Predictive.
Descriptive Data Analysis
Beginning with the very first fundamental pillar of modern-day analytical data, today, we now have the descriptive analytics process. This is most likely the most frequently employed type of data analytics that companies use to analyze the past of their customers and events. It’s also the most straightforward kind of data analytics among the four we’ll discuss in the present. It examines raw data and its trends and then describes the events occurring or occurring in the data context.
It aids in understanding the patterns for a specific time. If you’re looking for more insight into how sales vary from month to month or how much your views on channels have increased, this kind of data analysis is the method.
#Use Cases
Descriptive analytics simplify and comprehend information, including the following use scenarios.
- Financial Reporting
Financial reporting with descriptive analytics is organizing and analyzing the company’s financial history to give an accurate picture of the company’s performance. It includes key metrics such as revenue, expenses, and profit margins, helping users comprehend past financial trends. Through visualizations and reports, descriptive analytics facilitates better decision-making by highlighting strengths and gaps and areas of improvement.
- Sales Reporting
Descriptive analytics provide insight into trends and patterns based on past sales data. They allow you to identify the top-performing regions, products, and sales channels in real-time. They also let you assess the efficacy of promotions and help you optimize inventory levels, which can lead to improved sales strategies and greater profits.
- Website Traffic and Engagement Reports
Descriptive analytics can analyze past data about pages visited, page views, and user engagement. It helps determine the most popular content, peak traffic times, and user demographics. Using tools such as Google Analytics, you can create reports and visuals to learn about user behavior, improve the quality of your website’s content, and improve user experience based on previous performance.
- Demand Trends
Using descriptive analytics to analyze and anticipate trends in demand by analyzing customer behavior and preferences over time could help improve business marketing strategies and product development.
- Customer Segmentation
Descriptive analytics allows you to classify customers according to similar characteristics, behaviors, or demographics to enable more effective segmentation of customers. Looking through past customer records, it is possible to identify segments with similar buying patterns. This information can help create marketing strategies tailored to meet specific needs, increase customer engagement, and make specific products or services that fulfill the particular requirements of different segments of customers.
Diagnostic Analytics
While descriptive analytics examines historical data, diagnostic analysis delves deeper into why specific patterns or events occurred and seeks to discover the underlying causes behind particular results or problems. In determining the reasons that caused a specific result, organizations can adopt corrective steps and make informed decisions in the future.
Diagnostic analytics typically involves the use of sophisticated methods of statistical analysis, including hypothesis testing and data mining. Discover the relationship between different variables. For instance, diagnostic analytics can reveal the reasons for sales declines in a specific region and help a business adapt its marketing strategies to the changes. Tools for data visualization, such as Tableau or Power BI, are commonly used in diagnostic analytics to produce interactive visualizations of data.
Diagnostic analytics is especially relevant in marketing, where understanding customer behavior is vital.
#Use Cases
Here are some applications in which diagnostic analytics could be utilized across various industries.
- Employee Turnover Analysis
Diagnostic analytics can assist HR (HR) departments understand the factors contributing to employee turnover. Your company can identify improvement areas by looking more closely at employee satisfaction surveys, performance data, and other HR-related metrics.
- Customer Churn Analysis
Examining customer churn through diagnostic analytics involves analyzing data to discover the reasons for customer loss. This entails thoroughly reviewing customer behavior, feedback, and engagement metrics to find patterns or trends that might cause customers to stop their relationship with a company or service.
- Quality Control
Diagnostic analytics can be used to find irregularities, defects, or patterns that could influence the quality of your product. This could include analyzing with care the data from sensor manufacturing indicators, inspection results, and customer complaints. Utilizing diagnostic analytics to improve quality control can help you identify any defects’ root causes and allow you to take specific corrective measures.
- Identifying Outliers
Diagnostic analytics can aid in identifying anomalies in a data set that could indicate errors in collecting data measurements, measurements, or even unusual cases that require analysis.
- Fraud Detection
It is possible to use diagnostic analytics to spot odd patterns that could indicate fraud within financial transactions. This may include looking over the financial records for anomalies or unusual patterns in the use of credit cards or portfolios of investments.
Predictive Data Analysis
This is a more sophisticated kind of analytics typically utilized to answer the question, “What’s the next step in a business situation? The name implies that this type of data analytics predicts an event’s future outcomes based on the available data. The data can include the latest market trends and older information on your business’s performance. By combining the two data sources, this type will be able to determine how your company will perform in the coming season or how your videos will perform in the coming month.
#Use Cases
Predictive analytics can give organizations an advantage in competition and is a viable option in many scenarios, including the examples below.
- Predicting Customer Churn
Businesses use predictive analytics to determine clients who may quit transacting business. By anticipating churn, they proactively encourage these customers to stay with them by offering special deals or better customer service to ensure retention.
- Anticipating Consumer Trends
Predictive analytics can help brands anticipate consumer trends and product demands. This assists in maximizing inventory levels, managing supply chains, and improving overall operational efficiency.
- Sales and Demand Forecasting
Predictive analytics allow your business to predict future product demand and sales by analyzing the past, market trends, and various predictive modeling methods. By utilizing ML algorithmic models and statistics, companies can predict changes in demand and sales, identify peak times, improve inventory management, and remain flexible in responding to changes in market conditions.
- Risk Assessment
Predictive analytics allows your company to address risk proactively by forecasting market trends, recognizing your operations’ weaknesses, and identifying possible security risks. This requires analyzing historical data to discover indications and patterns that could be a precursor to adverse incidents.
- Predicting Employee Attrition
HR departments can use predictive analytics to anticipate the rate of employee attrition and possible turnover by reviewing previous information about the workforce and engagement metrics. This allows your company to adopt preventive measures, such as targeted retention strategies and improved hiring processes.
- Healthcare Risk Classification
Healthcare providers can use predictive analytics to pinpoint those most likely to suffer from specific health issues. This alerting system lets healthcare professionals act quickly and provide preventive treatment designed for these patients.
Prescriptive Data Analytics
The term predictive analytics refers to the fourth and last type of analysis based on data. It gives analysts an actionable path that businesses can follow to improve their performance after studying all available information. Based on the outcomes of previous kinds of analytics, particularly predictive and diagnostic analytics, it provides you with a plan of action that can help your company improve its performance. It is, without a doubt, an extremely complex yet crucial type of data analytics.
#Use Cases
Prescriptive analytics are great tools in a myriad of scenarios across various industries. Here are a few of the most popular.
- Supply Chain Optimization
Prescriptive analytics improves the efficiency of the supply chain through the use of optimizing algorithms as well as simulation software. It examines vast information on inventory levels, production capacity, transportation logistics, and the market’s demand to devise production, procurement, and distribution strategies. This strategy can lead to cost reductions, reduced time to market, and overall improvement in the performance of the supply chain.
- Personalized Product Suggestions
In e-commerce, “prescriptive analytics” requires analyzing customer behavior, purchase history, and personal preferences to create personalized product suggestions. Using ML algorithms, e-commerce platforms can suggest products suited to the individual user, increasing the chances of conversion and customer satisfaction.
- Proactive Fraud Prevention
Financial institutions employ prescriptive analytics to identify and avoid fraudulent activities. They analyze transaction patterns, user behavior, and historical fraud data to build models to detect abnormalities and recommend actions to prevent fraud.
- Dynamic Pricing Strategies Implementation
Prescriptive analytics may provide suggestions for dynamic price adjustments to assist brands in making well-informed decisions to increase their competitiveness. Brands can increase revenues by analyzing factors like product demand, competitors’ pricing, and customer behavior.
- Data-Driven Treatment Plan Development
Prescriptive analytics allow healthcare institutions to provide personalized treatment suggestions by studying patient data such as medical histories, clinical data, and clinical research. This combination of algorithmic optimization and decision-support systems can provide healthcare professionals with practical information to select the most appropriate treatment for a specific patient’s needs.
- Marketing Campaign Enhancement
Prescriptive analytics analyzes previous performance and customer segmentation to improve marketing strategies and offer suggestions for the most efficient timing, channels, and content.
The Key Takeaway
Data analytics can revolutionize decision-making by using insights gained from analyzing large and complicated data sets. Understanding the different kinds of analytics based on big data, the purpose for which each one is utilized, and their potential strengths and weaknesses is crucial to unlocking the full potential of data-driven decision-making.
Understanding the difference between different types of data analytics lets you make the most of the vast array of techniques and tools available. It will also help you choose the best approach to meet your business goals, ensuring a well-thought-out and well-informed use of the data analytics tools available.
With many ways to gather, categorize, and analyze data, companies increasingly depend on experienced data analysts and engineers to help them maximize efficiency, gain an advantage, decrease risk, and seize future opportunities.
By identifying and analyzing the best method for capturing and analyzing industry data, companies can improve their decision-making process and make better-informed decisions in a more complex and data-rich future.
Frequently Asked Questions
The four kinds of data analytics are predictive, diagnostic, descriptive, and Predictive.
- Descriptive analytics studies historical events and attempts to identify specific patterns in the information.
- Diagnostic analytics: It’s an advanced form of analytics that examines content or data to discover the reason for an event.
- Predictive analytics is a type of advanced analytics that uses data and information to answer the question, “What is likely to happen?”
- Prescriptive analytics gives suggestions for possible outcomes.
Forecasting or reporting analytics can classify injuries into various types based on variables such as the body part affected, the beginning and ending dates, and so on.
Descriptive analytics is a fundamental base for other kinds of business analytics. It requires analyzing historical data to discover the events that occurred and gain insight.
Data analytics tools are applied to the programs and software used for data analysis to carry out more efficient analytical processes and allow companies to gain from the data they collect. These tools include SQL Consoles, Automated, Business Intelligence, and more.
Descriptive analytics describes the historical data to give insight into past events. It aids in identifying patterns, trends, and patterns within the data without exploring their reasons.
Want to harness the full potential of data and transform possibilities into opportunities?
Pooja Upadhyay
Director Of People Operations & Client Relations