


“Impact measurement isn’t just about proving value to funders. When it’s treated as an opportunity to learn and drive continuous improvement, nonprofits unlock new pathways to organizational growth and resilience.”
The Transparency Imperative: Why Donors Are Watching
Here’s a statistic that should wake up every nonprofit leader: organizations that share transparent impact data receive 53% more in contributions than those that don’t.
Let that sink in. It’s not just about compliance or optics. Transparency directly correlates with funding success. The research from GuideStar (now Candid) backs this up across multiple studies – nonprofits with a Seal of Transparency averaged 53% more contributions the following year. Conversely, organizations that fail to demonstrate transparency lose 47% in potential contributions.
Donors have become sophisticated. They’re doing their homework, checking charity watchdog sites, and making decisions based on hard evidence. When a donor asks “what’s my money doing?” – they want specifics. Not promises. Not general statements about “changing lives.” They want to see outcomes: unemployment rates dropped by X%, school attendance increased by Y%, food insecurity decreased in region Z.

This shift reflects a deeper truth: the age of vague impact claims is over. Funders, whether individual donors, foundations, or government agencies, increasingly demand what’s called “accountability culture.” They’re investing in solutions to complex social problems. They need assurance that their investment actually works.
But here’s the challenge most NGOs face: they have the data. It’s just scattered across five different tools, manually entered into spreadsheets, and often arrives too late to inform actual decisions. That’s the problem we’re solving in this article.
The Reality Check: Where NGOs Stand Today
Before we talk solutions, let’s look at where the nonprofit sector actually stands with data analytics. A 2024 survey of nonprofit leaders reveals a somewhat sobering picture:
Only 10% of nonprofits rate their culture as “data informed.” That means 90% are still operating below a truly data-driven standard. Meanwhile:
- 41% report that their data is used for decision-making, but inconsistently and in silos
- 23% admit that decisions are rarely driven by data
- 26% can manage standard reports and trend analysis

This maturity gap represents both a challenge and an enormous opportunity. While most organizations recognize that data matters, few have the infrastructure, skills, or culture to make it work systematically.
The barriers are real and substantial. According to the same research, the top three obstacles are:
- Data fragmentation (55% cite this as a problem) – information scattered across Google Forms, CRMs, email, and Excel
- Staffing gaps (43%) – lack of people trained in data analysis or interpretation
- Organizational culture (43%) – leadership doesn’t prioritize or act on data insights

What’s interesting is that AI isn’t the bottleneck anymore. 59% of nonprofits are already using generative AI tools, yet only 22% have deployed predictive analytics, and just 4% use pattern recognition.5 The issue isn’t access to AI – it’s having the right kind of data infrastructure and organizational readiness to use it effectively.


Core Components of Impact Data Strategy
So what does a working impact data strategy actually look like? It’s not as complicated as many think, but it does require intention and structure.
1. Define Your Theory of Change
Before measuring anything, get clear on what you actually want to change. Not a broad mission, but specific outcomes. Your theory of change links your inputs, activities, outputs, outcomes, and final impact. Once this is clear, deciding what to measure becomes much easier.
2. Identify Key Metrics
You don’t need to track everything. Focus only on metrics that truly matter. This usually includes a mix of numbers (people served, jobs gained), stories (real-life changes), efficiency (cost and time), and early indicators like attendance or completion rates.
3. Build Data Collection Into Daily Work
Data collection shouldn’t feel like extra work. The best approach is to integrate it into everyday operations using digital forms, CRMs, surveys, and mobile tools. Clean data at the source saves time and avoids errors later.
4. Choose the Right Measurement Framework
You can use established frameworks like IRIS+, SROI, or custom metrics built around your theory of change. The right framework is the one that fits your goals, funder expectations, and team capacity.
Real-World Examples That Actually Worked
Let’s move from theory to practice. What do organizations that got this right actually do?
Example:1 : Feeding America: Real-Time Impact
- Earlier relied on studies every four years, which were accurate but slow
- Shifted to real-time dashboards with Tableau
- Enabled faster responses to food insecurity and better resource planning
- Strengthened credibility with donors through current, actionable data
Example: 2: Educate Girls: Scaling with Data
- Grew from 50 to 8,500 schools by using data from day one
- Used evidence to adapt programs across different contexts
- Built strong government and funder partnerships through proven results
- Data helped them scale thoughtfully, not blindly
Example: 3: Youth Mentorship: Mixing Data and Stories
- Tracked quantitative outcomes like grades, attendance, and jobs
- Used qualitative interviews to understand confidence and behavior change
- Measured community-level impact beyond individual success
- Combined approach made impact clearer and more compelling for funders and communities
The Tools of the Trade
You don’t need to build from scratch. A growing ecosystem of purpose-built tools exists. Here’s what’s actually being used:
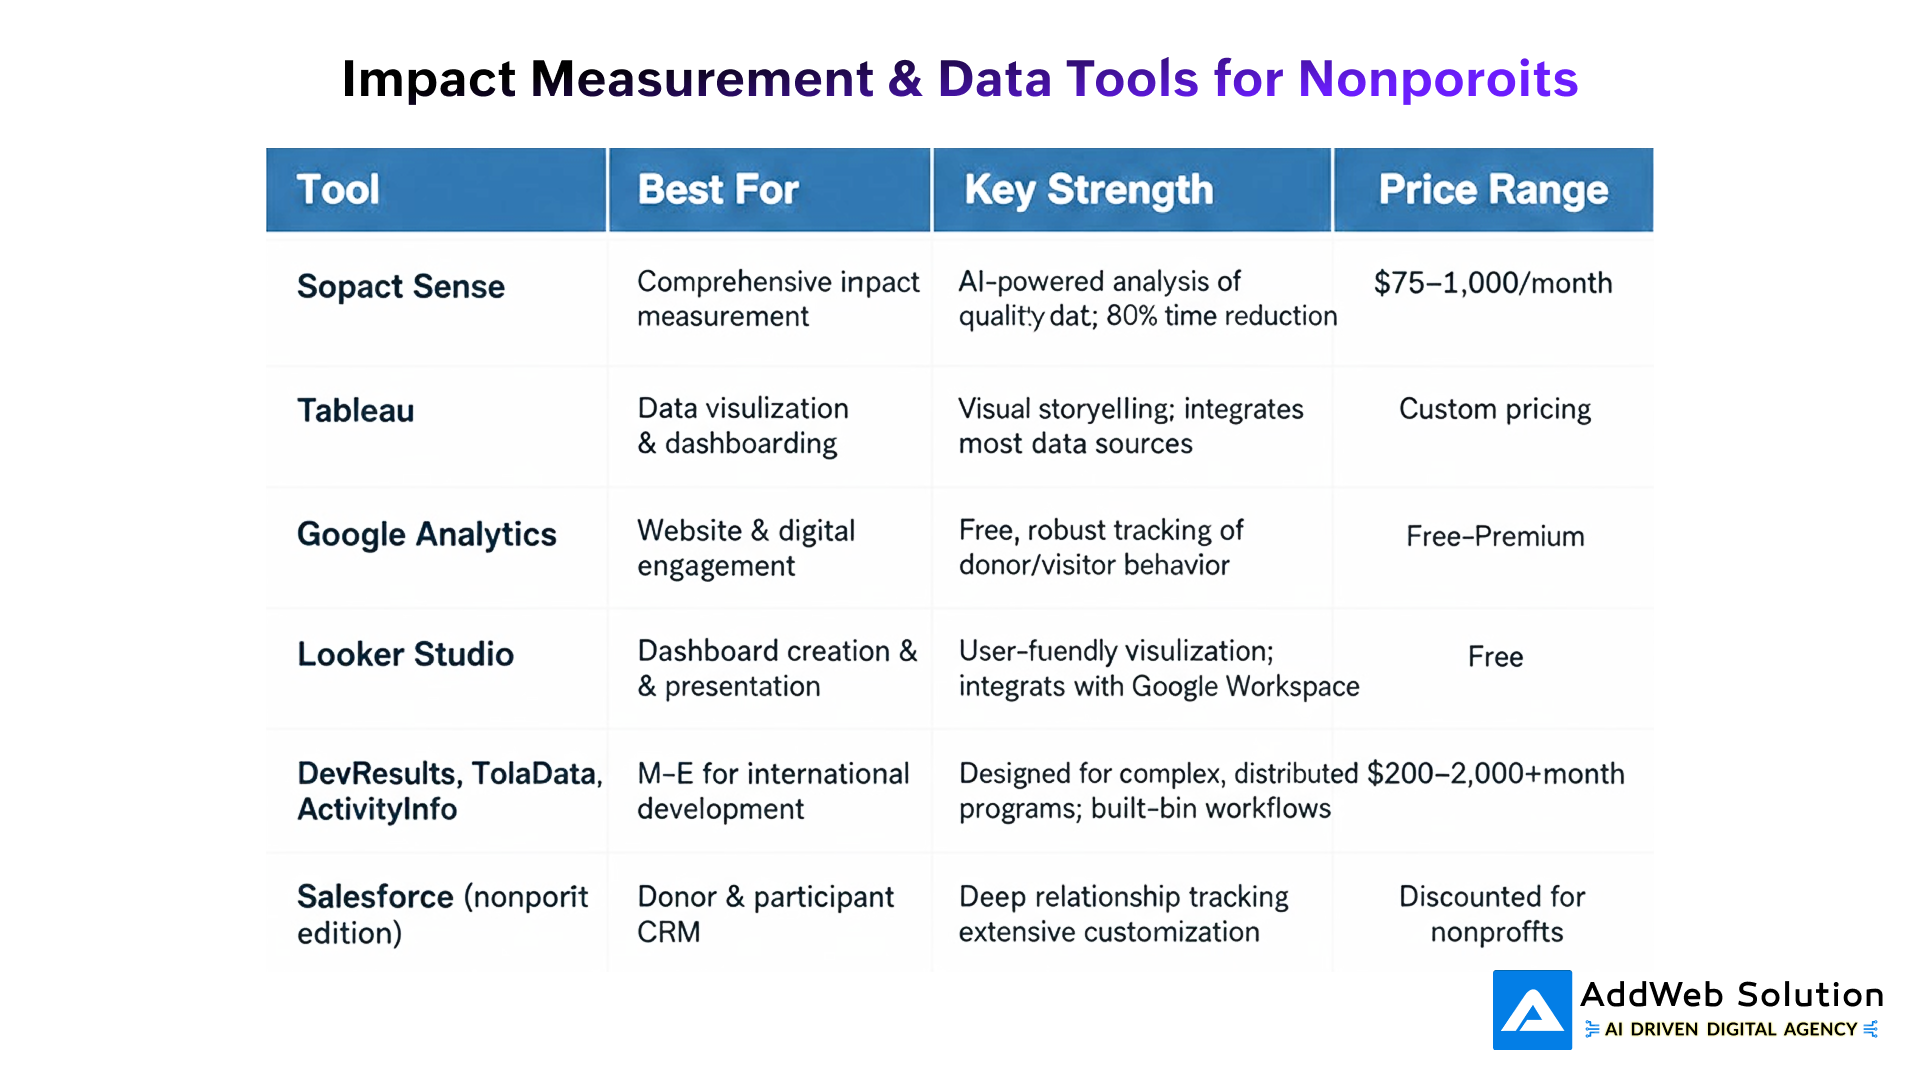
The key selection criteria:
- Does it handle your data types? (quantitative, qualitative, participant tracking)
- How easily can you integrate existing data sources?
- Can program staff actually use it, or does it require a data analyst?
- Does it provide the reporting your funders need?
Many organizations use a combination – Google Analytics for web, Sopact for program impact, Salesforce for donor relationships. The goal is integration without fragmentation.
Turning Raw Data Into Strategic Decisions
Here’s where many organizations drop the ball. They collect beautiful data, create impressive dashboards, and then… nothing changes.
The most important question isn’t “Did we measure impact?” It’s “Did we act on it?”
Effective data-driven organizations follow a feedback loop:
Collect → Analyze → Interpret → Decide → Act → Adjust Programs → Collect new data
The loop fails when organizations break the chain. You might collect data but never analyze it. Or analyze it without interpreting what it means. Or interpret it without translating to decisions.
Here are decision-making principles that work:
Make Data Accessible to Decision-Makers
Raw datasets are useless in board meetings. Create “executive dashboards” that answer specific questions: Are we meeting program goals? Which programs are most cost-effective? Where are we losing participants? How are outcomes different by demographic?
These should update regularly – monthly or quarterly – so leaders make decisions based on current information, not last year’s annual report.
Close the Feedback Loop with Beneficiaries
This is often overlooked. When you measure impact, share the findings with the people your programs serve. Ask them:
- Do these metrics matter to you?
- Are we measuring what actually changed in your life?
- What should we measure differently?
This participatory approach to data creates stronger insights and keeps programs accountable to beneficiaries, not just funders.
Segment Your Data to Find Patterns
Aggregate numbers hide important truths. Instead of “we serve 1,000 people,” dig deeper:
- How many were first-time clients vs. repeat?
- Did outcomes differ by age, gender, or geography?
- Which staff member’s programs had best outcomes?
- When in the year do we see highest demand?
Segmentation reveals where impact is strongest and where programs might need adjustment. This granular insight drives smarter resource allocation.
Use Predictive Models to Anticipate
Once you have historical data, use it to predict. Which program participants are at risk of dropping out? Which donors are likely to upgrade their giving? Which geographic regions will see spikes in need?
This shifts you from reactive (responding to past events) to proactive (anticipating future challenges). 59% of nonprofits are already experimenting with generative AI, but predictive models still lag at 22% adoption. This represents a major opportunity gap.
Common Pitfalls and How to Avoid Them {#pitfalls}
We’ve seen what works. Let’s talk about what doesn’t:
Pitfall #1: Data for Compliance, Not Learning
Many organizations collect data just to satisfy funders, then ignore the insights.
Fix: Treat data as a learning tool first. Solve internal problems, and reporting becomes easier.
Pitfall #2: Overcomplicated Measurement
Trying to track everything leads to burnout and poor-quality data.
Fix: Focus on 3–5 core outcomes and measure them well before expanding.
Pitfall #3: Staff Measurement Fatigue
When data collection feels like extra work, it gets skipped or rushed.
Fix: Embed data into daily workflows and keep tools simple and mobile-friendly.
Pitfall #4: Siloed Data and Teams
Program, finance, and fundraising teams often work in isolation.
Fix: Review data together regularly so insights actually drive decisions.
Pitfall #5: Dashboards Without Context
Pretty charts mean nothing without comparison or explanation.
Fix: Add targets, trends, and real stories to give numbers meaning.
Discover how to convert impact data into actionable strategies for real-world change.

Pooja Upadhyay
Director Of People Operations & Client Relations
Building Your Data Culture {#culture}
This is the meta-level work that most organizations skip. Even perfect data tools fail in organizations without data culture.
Data culture means:
- Leadership prioritizes and acts on data
- Staff sees data as a tool for improvement, not judgment
- Decisions get made transparently, with reasoning explained
- Failures are treated as learning opportunities (“The data told us this approach didn’t work – here’s what we’ll try next”)
- Celebration of evidence-based wins
How to Build It:
Start small and celebrate wins. Find one area where data directly improved outcomes. Share that story widely. Show the before/after.
Train staff, don’t just train leaders. If frontline workers don’t understand why they’re collecting data or how it’s used, they disengage. Basic data literacy matters.
Acknowledge resource constraints openly. You might not have a full-time data analyst. That’s okay. Be realistic about what you can measure given your capacity. Partial transparency beats abandoned ambitions.
Make data accessible. Stop locking insights in analyst reports only leadership sees. Create simple, visual monthly updates that everyone can understand.
Iterate. Your first measurement system won’t be perfect. Build feedback loops and refine over time. Data culture develops gradually.
Conclusion
Impact data was never meant to live in spreadsheets or annual reports alone. When used well, it becomes one of the most powerful tools an NGO has – to learn faster, adapt smarter, and serve communities better. The organizations that stand out today aren’t just transparent because funders demand it; they’re data-driven because it helps them make better decisions.
The shift is simple but profound: stop treating data as a compliance task and start using it as a compass. One that guides strategy, strengthens donor trust, improves programs, and builds long-term resilience. You don’t need perfect systems or advanced AI to begin – just clarity on what matters, a few meaningful metrics, and the discipline to act on what the data tells you.
In a world where donors are watching closely and social challenges are becoming more complex, the nonprofits that turn impact data into action won’t just survive – they’ll lead.
Source URLs
- https://www.donorsearch.net/resources/nonprofit-analytics/
- https://www.bridgespan.org/insights/nonprofit-organizational-effectiveness/what-is-impact-measurement-and-how-can-organizations-use-it
- https://blog.acumenacademy.org/17-impact-measurement-tools-you-should-know-about-and-how-to-start-using-them
- https://www.nonprofitpro.com/article/15-compelling-nonprofit-stats-from-2024/
- https://www.guidestar.org/UpdateNonprofitProfile/transparency/
- https://socialimpactarchitects.com/sroi/
- https://www.impacteurope.net/sites/www.evpa.ngo/files/publications/EVPA_IM_Case_Studies_report_2016.pdf