


MLOps evolved from a niche field to a multi-billion-dollar industry in a matter of a few years. The current global MLOps market size is estimated to be around 2.4-2.5 billion USD in 2025 and is expected to reach between 25 billion and almost 90 billion USD in the mid-2030s, depending on the analyst you trust. Such rapid growth led to a gold rush of point solutions—and a whole lot of very messy AI stacks.
By 2026, many organizations have reached a point of quiet desperation. Tool sprawl is no longer a nuisance; it’s a problem of cost, risk, and burnout. The solution is clear: consolidate, standardize, and head towards a unified AI and MLOps platform.
This article will dissect why this wave of consolidation is happening at this moment, what it looks like, and how to navigate it without boxing yourself into another expensive dead end.
1. How We Got Here: The Era of Bloated AI Tool Stacks
When ML shifted from research to production, what happened was exactly what engineers have always done: they reached for the best tool for a particular job. A “modern” AI stack, therefore, has grown to encompass:
- Data ingestion and ETL tools
- Feature stores
- Experiment tracking and model registry
- Training orchestration and pipelines
- CI/CD for ML and deployment frameworks
- Online inference serving and A/B testing
- Monitoring, observability, and alerting
- Governance, explainability, and compliance tooling
Today, it’s not unusual to see 5+ tools just to handle one ML lifecycle, before you even get to data platforms and observability. On the data side, it’s been found that 40% of data engineers spend one-third of their day simply switching between tools and orchestrating, as opposed to actual data science work.
“Best-of-breed” has quickly devolved into “death-by-dashboard.”
2. Why 2026 Is the Breaking Point
A combination of factors has led to 2026 being the point at which unwieldy AI stacks become unaffordable.
2.1 Explosive spend on AI and MLOps
There is consensus among analyst firms on one thing: MLOps is on a rocket path.
- Precedence Research puts the market at 2.43 billion USD in 2025, growing to 56.6 billion USD by 2035, with a 37% CAGR from 2026.
- Fortune Business Insights predicts a similar 2025-2026 baseline and a market that reaches about 25.9 billion USD by 2034.
- Other predictions are even more optimistic, with estimates reaching 89 billion USD by 2035.
This is not just market research – it also reflects actual spending, as AI projects are transitioning from pilots to production and the associated infrastructure lines in the budget are expanding.
Graph: Global MLOps Market Forecast (Precedence Research)
The chart below shows how one major forecast sees MLOps spending rising from 2.43b USD in 2025 to 56.6b USD by 2035.
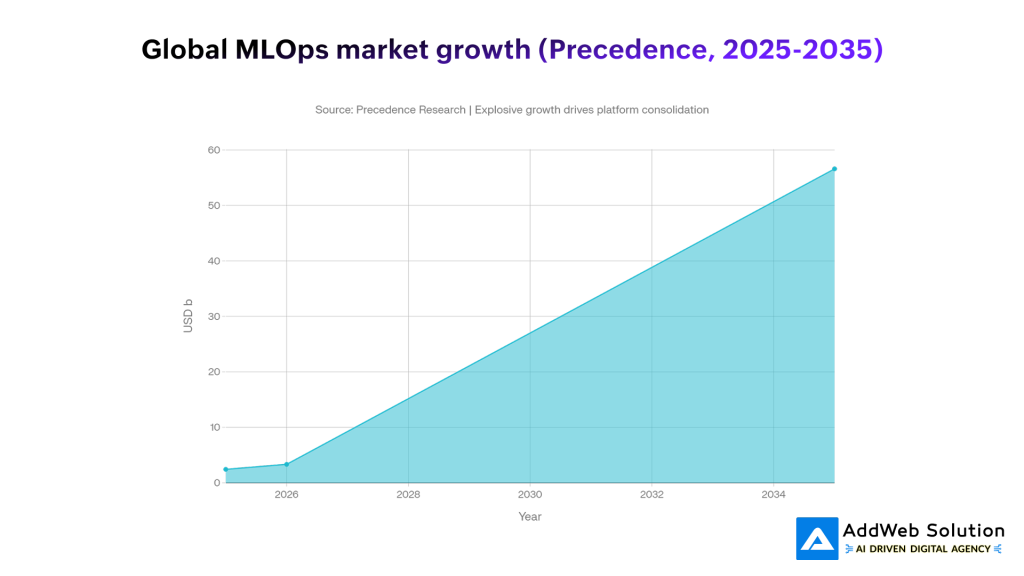
The budget curve is clear. The uncomfortable question inside many organizations is: what exactly are we buying with all those tools?
2.2 Tool sprawl is burning out teams
Tool sprawl is not a hypothetical issue; it is quantifiable. A significant survey conducted in 2025 among 1,000+ IT and security professionals revealed the following:
- Teams with 1-5 tools: 17% experience high burnout
- Teams with 16+ tools: 50% experience high burnout
- Common pain points:
- 49%: too many redundant tools
- 46%: gaps or failures between tools
- 41%: security issues because of poor integration
This means that the more tools you introduce to “help,” the more time your team will spend babysitting them and less time doing actual work.
On the data side, a separate analysis found:
- 44% of engineering teams spend 25,000–100,000 USD per month on their data stack
- Only 12% say they see meaningful ROI from that spend
- A significant share of that cost is not licenses, but integration, maintenance, and overlapping capabilities
2.3 Observability and infra show the same pattern
Observability surveys reveal similar dynamics: more than two‑thirds of teams report using four or more observability tools, and 84% struggle with costs and complexity. Teams discard telemetry to control bills, creating visibility gaps—while still juggling multiple agents, UIs, and alerting systems.
When you zoom out, AI, data, security, and observability all tell the same story: tool sprawl has become a structural tax on productivity.


3. The Shift: From Best‑of‑Breed to Unified MLOps Platforms
The market’s response has been predictable: follow the money.
Analyst and vendor reports converge on a clear trend: platforms, not individual tools, capture most of the new value.
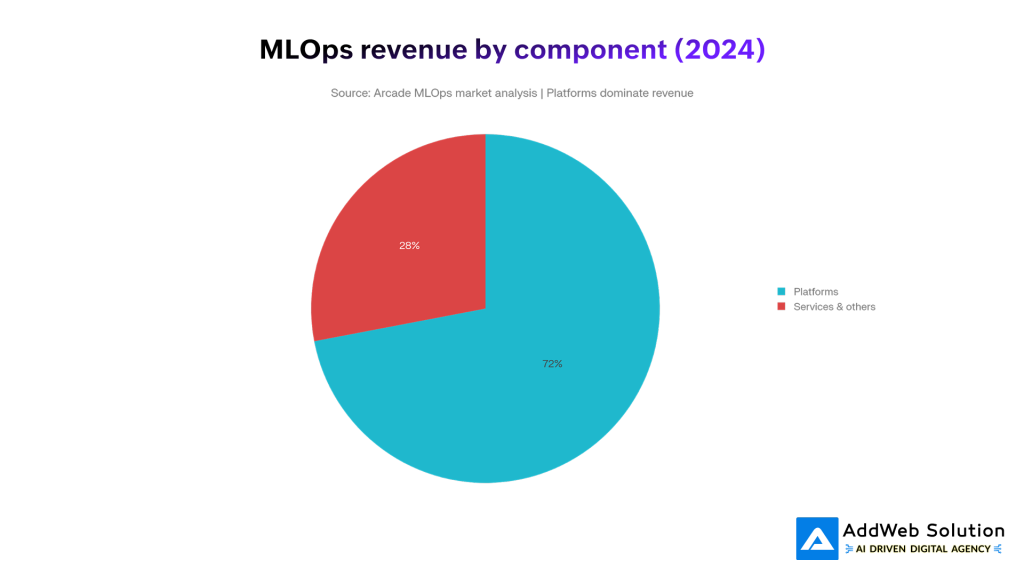
- Several analyses put MLOps platforms at 65–72% of total market revenue in 2024–2025.
- A detailed MLOps platform report notes a moderately concentrated market where a handful of vendors (often cloud‑based) hold significant share, while smaller point solutions fight for niches.
- Investment reports highlight platform consolidation and M&A as a core theme: larger players systematically acquire specialized MLOps tools and fold them into broader platforms.
Pie chart: Platforms vs. everything else
The revenue split visually underlines the point: platforms dominate.
In practice, 2026 is the moment many organizations accept that gluing together 15 tools is more expensive than paying for one strong platform and a handful of truly differentiated add‑ons.
4. Bloated Stack vs. Consolidated Platform: A Side‑by‑Side View
To make this concrete, it helps to compare the “classic” 2022–2023 stack with what leading teams are moving toward in 2026.
Table 1 – Old vs. New MLOps Stack
| Dimension | Bloated AI Tool Stack (2022–2023) | Consolidated MLOps Platform (2026) |
| Tool count | 10–20+ tools across data, ML, infra, and observability | 3–7 tools, with 1–2 core platforms anchoring the lifecycle |
| Integration effort | Custom glue code, brittle APIs, one‑off scripts | Native integrations, shared metadata, unified auth and RBAC |
| Governance & audit | Fragmented logs and approvals across systems | Centralized lineage, approvals, model registry, and policy enforcement |
| Time‑to‑production | Weeks/months to wire experiments into production | Days/weeks via reusable templates and standardized pipelines |
| Cost structure | High license + 2–3× in maintenance/integration over time[7] | Higher platform line item, but lower total cost of ownership over 12–24 months |
| Team experience | Constant context‑switching, dashboard fatigue, high burnout[8] | Fewer dashboards, clearer ownership, more time for strategy and experimentation |
| Security posture | Inconsistent controls, integration gaps create attack surface[9] | Unified identity, observability, and policy layers across the stack |
You do not need to be “anti‑tool” to see why the second column is winning.
5. What Consolidation Looks Like in Real Stacks
Consolidation is not just “buy one mega‑vendor and uninstall everything else.” In practice, leading AI teams are converging on a few recurring patterns.
5.1 Platform‑centric, not tool‑centric
Common consolidation directions include:
- Cloud‑native AI stacks
Standardizing on AWS, Azure, or GCP ML services (training, deployment, monitoring) plus their native data platforms and identity. - Lakehouse and data platforms with built‑in ML
Using lakehouse or warehouse platforms as the center of gravity for data + ML, with integrated feature stores, notebooks, and model serving. - Dedicated MLOps platforms
Choosing one platform that bundles experiment tracking, pipelines, model registry, and monitoring, then integrating it thoughtfully with existing CI/CD and data platforms. - Unified observability and FinOps
Replacing multiple monitoring tools with one observability platform and one cost‑management solution, then piping everything from ML, data, and infra into it.
Analyst notes on the MLOps platform market emphasize this platform concentration and a growing level of M&A as larger players absorb niche tools into broader offerings.
5.2 Measurable benefits from consolidation
Consolidation is not just theory. For example, a customer survey from one IT operations platform reported:
- 40% reduction in total tool stack after consolidating onto a single platform
- Average of 2.43 tools removed per customer
- Reduced mean time to resolution (MTTR) and fewer context switches for ops teams
MLOps‑specific case studies echo similar outcomes: fewer vendors, faster onboarding, and lower integration overhead over time.
6. The Economics: Why Sprawl Is So Expensive
Tool sprawl creates cost in three layers:
- Licensing and consumption
- Many data and AI tools use usage‑based pricing; initial 500 USD/month “pilots” quietly become five‑figure commitments as workloads grow.
- Integration and maintenance
- Teams commonly spend 2–3× their license costs on integration work, custom connectors, and maintenance.
- Mid‑market organizations report spending 50–75% of their time on tool maintenance, not strategic projects.
- Human cost
- High burnout rates in tool‑heavy environments (50% at 16+ tools vs. 17% with streamlined stacks) translate into attrition, lost knowledge, and slower delivery.
When CFOs and CIOs scrutinize AI ROI in 2025–2026, stacks full of overlapping tools become a very easy target.
7. A Practical Playbook: How to Rationalize Your AI Tool Stack in 2026
Consolidation is not as simple as “rip and replace.” A structured approach helps you move fast without breaking everything.
Step 1 – Map your current stack and flows
Create a brutally honest inventory:
- All tools used across data, ML, infra, security, and observability
- Owners, usage levels, and key use cases
- Where each tool sits in the ML lifecycle (data prep, training, deployment, monitoring, governance)
- What breaks if it disappears tomorrow
Step 2 – Identify overlaps and “zombie” tools
Look for:
- Tools that replicate capabilities your core platforms already provide
- Tools used by <10% of the team or only for legacy workflows
- Tools that have not seen active usage in 3–6 months
- Monitoring or analytics tools watching the same metrics from different angles
This is often where low‑risk removals (and quick wins) live.
Step 3 – Choose your anchor platforms
Based on your environment and constraints:
- Pick one primary data platform (lakehouse/warehouse)
- Pick one primary MLOps platform (or cloud ML stack)
- Pick one primary observability stack with clear coverage for logs/metrics/traces
Criteria to prioritize:
- Integration depth with your cloud and data estate
- First‑class support for your programming languages and frameworks
- Governance, lineage, and audit capabilities
- Cost transparency and predictable pricing (or at least guardrails)
Many MLOps and AI platform reports emphasize that cloud‑based platforms with strong integration ecosystems are winning, particularly for organizations that want to avoid building everything in‑house.
Step 4 – Design a consolidation roadmap
Instead of a big‑bang cutover, plan:
- Wave 1 (0–3 months):
- Remove “zombie” tools
- Stop net‑new projects on deprecated platforms
- Centralize identity and access policies where possible
- Wave 2 (3–9 months):
- Migrate low‑risk workflows (internal dashboards, non‑critical models) to target platforms
- Standardize pipelines and CI/CD around a smaller set of tools
- Consolidate monitoring into a single pane of glass
- Wave 3 (9–18 months):
- Migrate critical revenue‑impacting models
- Decommission legacy tools with a clear rollback plan
- Formalize platform engineering responsibilities around AI and MLOps
Step 5 – Put humans at the center
Consolidation is as much a people project as a technical one:
- Involve practitioners in vendor evaluations and platform design
- Track burnout, on‑call load, and time spent on “tool babysitting” before and after
- Provide real enablement: internal docs, templates, office hours, and champions
The Kandji survey is clear: more tools correlate directly with burnout and attrition. Reducing that burden is a business outcome, not just a cost‑cutting tactic.
8. Visual Snapshot: Why Platforms Are Winning
To tie the trends together, it helps to keep two visuals in mind:
- MLOps market growth curve – Rising from a few billion USD in 2025 to tens of billions by 2035 drives intense pressure to make AI delivery sustainable.
- See the earlier line chart on forecasted global MLOps market growth.
- Revenue split: platforms vs. everything else – Platforms already capture roughly two‑thirds to three‑quarters of total MLOps revenue, with that share expected to increase as more organizations consolidate.
- The pie chart above visually reinforces how much economic weight has shifted to platforms.
In other words, the money and the tooling gravity are already moving in the same direction.
9. Risks of Over‑Consolidation (and How to Avoid Them)
Consolidation is not risk‑free. Three anti‑patterns to watch:
- One‑vendor lock‑in
- Over‑indexing on a single cloud or platform without abstraction layers can trap you in pricing or capability corners later.
- Mitigation: use open formats, standard APIs, and modular architecture so migration is painful, not impossible.
- Feature checklist thinking
- Swapping 10 tools for one mega‑platform that claims to do everything, but does many things poorly, can stall your ML roadmap.
- Mitigation: pilot deeply on your hardest real use cases, not synthetic demos.
- Ignoring niche but strategic tools
- Some specialized domains (e.g., safety tooling for high‑risk use cases, regulated industry governance) still benefit from focused tools.
- Mitigation: keep a small “strategic exceptions” list with clear owners and sunset criteria.
A healthy 2026 stack is platform‑first, not platform‑only.
10. Making Your 2026 Stack Boring (in a Good Way)
The most successful AI organizations in 2026 are not the ones with the flashiest tool logos on their architecture slides. They are the ones whose stacks are:
- Boringly consistent
- Easy to reason about
- Governable and auditable
- Cost‑predictable
- Pleasant for engineers to work in
The consolidation wave in MLOps is not about killing innovation; it is about killing unnecessary complexity. With the market maturing, platforms absorbing point solutions, and the real cost of sprawl now visible in budgets and burnout surveys, the “more tools = more capability” era is ending.
If 2023–2024 were about experimenting with everything, 2026 is about deciding what you will standardize on for the next five years. The teams that do this thoughtfully will spend less time wiring tools together—and more time shipping AI that actually moves the business.
Suggested Visuals You Can Add to This Blog
To keep the article visually engaging when you publish it:
- Hero image (top): Chaotic stack vs unified platform (as indicated above).
- Section break image: Illustration of an engineer juggling many dashboards, contrasted with a single clean console.
- Process diagram: Simple flowchart showing the consolidated ML lifecycle: data → training → deployment → monitoring → governance on a single platform.
- Screenshots (optional): Redacted or anonymized internal dashboards before vs after consolidation, if your organization allows it.
Use these alongside the pie chart and line graph to turn the post into a compelling, data‑backed narrative rather than another abstract think‑piece.
Get Started with Custom AI Solutions Today!

Pooja Upadhyay
Director Of People Operations & Client Relations
⁂
- https://cpduk.co.uk/news/the-growing-demand-for-python-developers-in-2023
- https://www.understandingrecruitment.com/knowledge-hub/blog/2023-hackerrank-developer-report-top-developer-languages/
- https://onymos.com/blog/highlights-from-the-2024-stack-overflow-dev-survey/
- https://www.programmez.com/actualites/python-developers-survey-2023-les-resultats-retenir-36817
- https://lp.jetbrains.com/python-developers-survey-2023/
- https://survey.stackoverflow.co/2024/technology
- https://www.theregister.com/2025/08/19/python_survey/