
Capability 04 of 4 · AI Robotics for Manufacturing
Industrial AI Dashboards
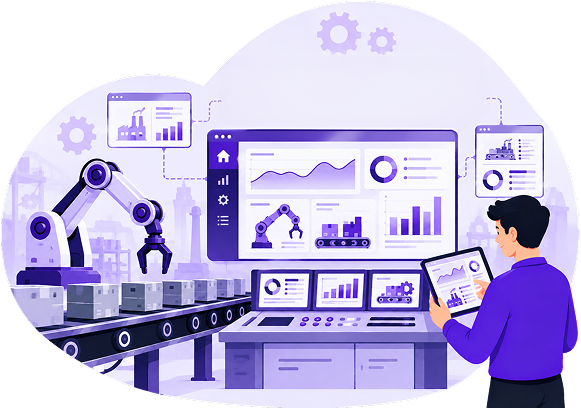
Centralized web dashboard built on React.js and Next.js with live CCTV AI overlay, role-based access control, multi-plant aggregation, and real-time alerts via SMS, email, and WhatsApp. From shop floor to headquarters in one interface.

The Visibility Gap
Your Production Data Is Trapped on the Shop Floor
AI vision and robotic sorting generate valuable data every second. Without a centralized dashboard, that data stays locked in edge devices and PLC logs.

No Real-Time Headquarters View
Plant managers see their line. Regional VPs do not. Multi-plant operations need aggregated visibility without flying to each site.
Alerts Arrive Too Late
A defect rate spike at 2 AM does not reach the quality manager until the 7 AM shift review. By then, hundreds of defective parts have shipped.

Audit Trail Lives in Spreadsheets
Regulatory audits demand timestamped, per-part inspection records. Manual logs and export scripts are not audit-ready.

No Cross-Plant Benchmarking
When three plants run the same line, you need to compare yield, defect rates, and uptime side-by-side to identify which plant’s process to replicate.
Dashboard Capabilities
What the Dashboard Does for Each Role
Super Admin
Full System Configuration
User management, role assignment, plant configuration, alert rule definition, data retention policies, and system health monitoring across all locations.
Manager
Plant-Level Analytics
Production yield, defect trend reporting by class and severity, shift comparison, line uptime tracking, and exportable reports for executive review.
Supervisor
Line-Level Monitoring
Live CCTV viewer with AI overlay, real-time alert response, incident creation and resolution, and station-level defect rate tracking.
Viewer
Read-Only Dashboards
Assigned dashboard views for quality team members, customer audit visitors, or regulatory inspectors without system modification access.
Technology Stack
Built on Production-Proven Web Infrastructure
React.js + Next.js
Modern frontend framework for server-rendered, responsive dashboard UI. Works on desktop, tablet, and mobile browsers without a native app.
PostgreSQL + Redis
PostgreSQL for durable production data storage with full query capability. Redis for caching, session state, and real-time data buffering.
WebSockets
Persistent connection for live data streaming. Camera feeds, defect counts, and alert status update in real time without page refresh.
Twilio + SendGrid + WhatsApp
Three-channel alert delivery. SMS via Twilio for immediate reach, email via SendGrid for detailed reports, WhatsApp Business API for team messaging.
TLS + RBAC + Audit Logging
Encrypted data in transit and at rest. Per-user permissions. Every user action logged with timestamp for compliance and security review.
Async Edge Sync
Plant edge systems push data asynchronously. A network outage at one plant does not affect dashboard visibility for other plants or headquarters.
AI Robotics Capabilities
Connected to the Full Production System
The dashboard aggregates data from AI vision inspection, robotic sorting, and computer vision as one unified data layer.
Six Commitments That Define How We Build Industrial Dashboards
What You Get Beyond the Deliverables
Dashboard architecture designed around your decision hierarchy, not a generic template.
Every view, alert rule, and report scoped to the roles that use them. No feature bloat.
We map your org chart to access roles, your SLAs to alert thresholds, your compliance needs to audit exports.
94+ Clutch reviews, ISO 9001 and 27001, Google Cloud Partner. Auditable proof.
Full source code. No SaaS dependency. Your dashboard runs on your infrastructure.
Add plants, lines, and roles without re-architecture. The dashboard scales with your operations.
Client Verification
What Our Clients Report






“The AI-powered platform has completely transformed how we manage our website. Content creation is now faster, user engagement has significantly improved, and our team can focus more on driving community impact instead of handling manual website tasks.”
Founder of CityOutreach
Digital Platform – USA -80% Improved User Engagement
“ Partnering with AddWeb on the Clevuno platform has transformed how we create content and engage with users. The integration of AI-powered video, live avatars, and conversational intelligence has greatly enhanced personalization, improved efficiency, and enabled scalable growth across our operations. ”
Project Leader, Clevuno
Digital Transformation Platform Delivering Advanced AI Solutions
“ Working with AddWeb Solution on the DialogixAI platform was an exceptional experience. We needed a robust AI platform capable of dynamic video production, live avatars, and real-time conversational AI. The team’s expertise in Next.js, React, and AWS Amplify enabled seamless integration of advanced AI features. Their attention to detail, professionalism, and clear communication ensured the project exceeded our expectations. The final platform is intuitive, scalable, and perfectly aligned with our digital transformation goals. ”
Manager, DialogixAI
AI Platform For Smarter Business Engagement
Insights
Dashboard Engineering Perspectives
AI
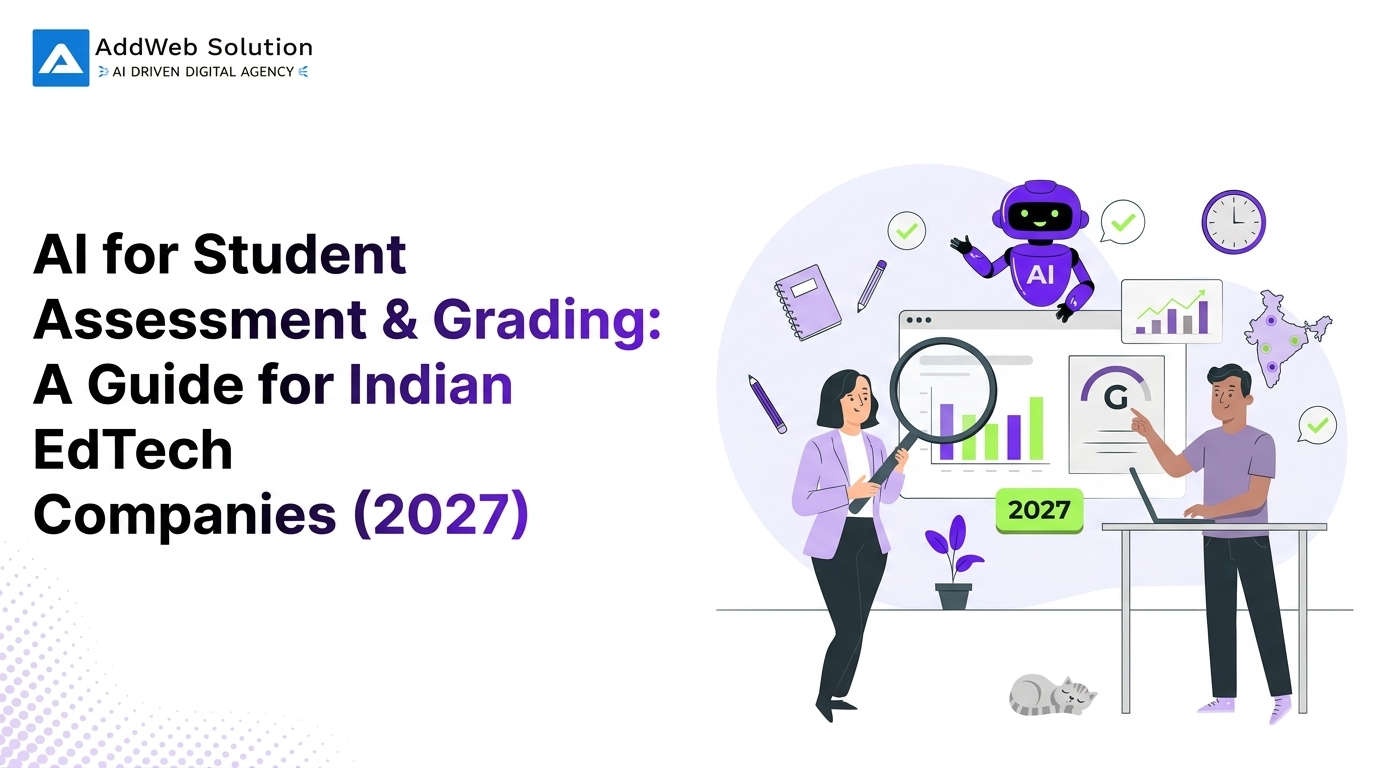
AI for Student Assessment & Grading: A Guide for Indian EdTech Companies (2027)
The Question Every EdTech Founder Gets Wrong: “Can We Automate Grading?” Wrong question. CBSE already answered a version of it in 2026, and the answer wasn’t a clean yes.
Read the post
AI · WordPress

AI Can Build a Website in Minutes. So Why Do Businesses Still Need WordPress Experts?
AI has made website creation dramatically faster. But getting a website online is not the same as building a website that performs, converts, stays secure, and grows with the business.
Read the post
AI
AI in Indian Healthcare: How Hospitals Are Using Robots and AI Diagnostics in 2026
A 45-Day-Old Baby, a Robot, and the Year Indian Healthcare Stopped Piloting According to The Manila Times, in 2026, a 45-day-old infant in India underwent kidney surgery performed with a homegrown surgical robot.
Read the post
Questions About Industrial Dashboards
What Operations Leaders Ask About AI Dashboards
An industrial AI dashboard is a centralized web application that aggregates real-time data from AI vision inspection stations, robotic sorting cells, and computer vision systems across one or more manufacturing plants. It provides live production monitoring, AI-classified defect analytics, role-based access control, and real-time alerting through SMS, email, and WhatsApp.
The dashboard is built on React.js and Next.js for the frontend, PostgreSQL for production data storage, Redis for caching and real-time state, and WebSockets for live data streaming. Alerting uses Twilio for SMS, SendGrid for email, and WhatsApp Business API for messaging. The entire stack is your IP on project completion.
Yes. Multi-plant architecture is a core design principle. Headquarters sees an aggregated view across all plants with drill-down to individual plant, production line, and station level. Each plant’s edge systems sync data asynchronously to the central dashboard, so a network outage at one plant does not affect visibility into others.
Four standard roles: Super Admin with full system access and configuration, Manager with plant-level analytics and reporting, Supervisor with line-level monitoring and alert response, and Viewer with read-only access to assigned dashboards. Custom roles can be configured to match your organizational hierarchy.
The dashboard streams live camera feeds from inspection stations with AI classification results overlaid in real time. Supervisors see bounding boxes around detected objects with defect class labels, confidence scores, and pass/fail status directly on the video feed. No separate monitoring application is needed.
Configurable alert rules trigger on defect rate thresholds, line stoppages, system health warnings, or any custom condition. Alerts are delivered via SMS through Twilio, email through SendGrid, and WhatsApp Business API. Each alert includes the station, timestamp, defect class, and severity level. Escalation chains route unacknowledged alerts to the next level.
When a critical alert fires, the dashboard creates an incident record with full audit trail: alert trigger, responder assignment, actions taken, resolution notes, and timestamp at each step. Incidents can be escalated, reassigned, and closed with root-cause documentation. The audit trail is exportable for compliance reporting.
Yes. The React.js frontend is fully responsive and works on any modern browser across desktop, tablet, and mobile. Supervisors on the plant floor can monitor their lines and respond to alerts from a phone without a dedicated mobile application.
Edge systems at each production line push data to the central dashboard via encrypted API endpoints over your plant network. Async synchronization ensures the production line continues operating if the dashboard connection is temporarily interrupted. Real-time feeds use WebSockets for low-latency streaming when the connection is active.
Production yield analytics, defect trend reporting by class and severity, line uptime tracking, shift comparison, and cross-plant benchmarking. Reports are exportable as CSV or PDF. Custom KPI dashboards can be configured for executive, operations, and quality teams.
Role-based access control with per-user permissions. Session management with configurable timeout. All data encrypted in transit via TLS and at rest in PostgreSQL. Audit logging for every user action. The system runs on your infrastructure or a dedicated cloud tenant — no shared multi-tenant environment.
You do. Full source code, deployment configuration, database schema, and operational documentation transfer on final payment after Site Acceptance Testing. No recurring SaaS fees, no vendor lock-in, no hosted dependency on AddWeb infrastructure.
The dashboard is included in the Production Line Build at $85K to $145K as an integrated component. For multi-plant deployments with advanced analytics and cross-plant benchmarking, dashboard scope is defined during Discovery and priced as part of the Multi-Plant Rollout at $360K or more.
Book a Discovery Call through our Calendly. Dashboard requirements are scoped during the $15K to $22K Discovery Sprint alongside the vision and robotic systems it monitors. We define the role hierarchy, alert rules, analytics views, and integration points as part of the overall system architecture.
Your Move
Get Visibility Across Every Plant
Dashboard scope is defined during Discovery alongside the AI systems it monitors.

