


Most NGO teams know the frustration. A major donor asks how their gift last year translated into measurable change in a specific region. The finance system shows the amount. The program team has activity reports. The monitoring team has outcome indicators in a different spreadsheet.
Someone spends half a day stitching the pieces together, and the answer still feels incomplete. That gap between generosity and proven impact is exactly where knowledge graphs start to matter.
In 2026, the technology that once lived mainly in large enterprises is becoming practical for mission-driven organizations. A knowledge graph treats people, programs, donations, locations, and results as connected entities rather than isolated rows.
Once those links exist, questions that used to require manual detective work become straightforward queries. At AddWeb Solution we have seen the difference this makes when NGOs move from scattered data to a living map of their work.
Why NGO data stays fragmented
Nonprofits collect rich information, yet it rarely lives in one coherent place. Donor records sit in a CRM. Program activities and budgets live in grant-management tools or Excel. Outcome data lives with monitoring and evaluation teams, often in forms that change from donor to donor.
Beneficiary details, partner organizations, and geographic coverage add more layers. The result is a classic data-silo tax: staff time spent reconciling instead of learning or reporting.
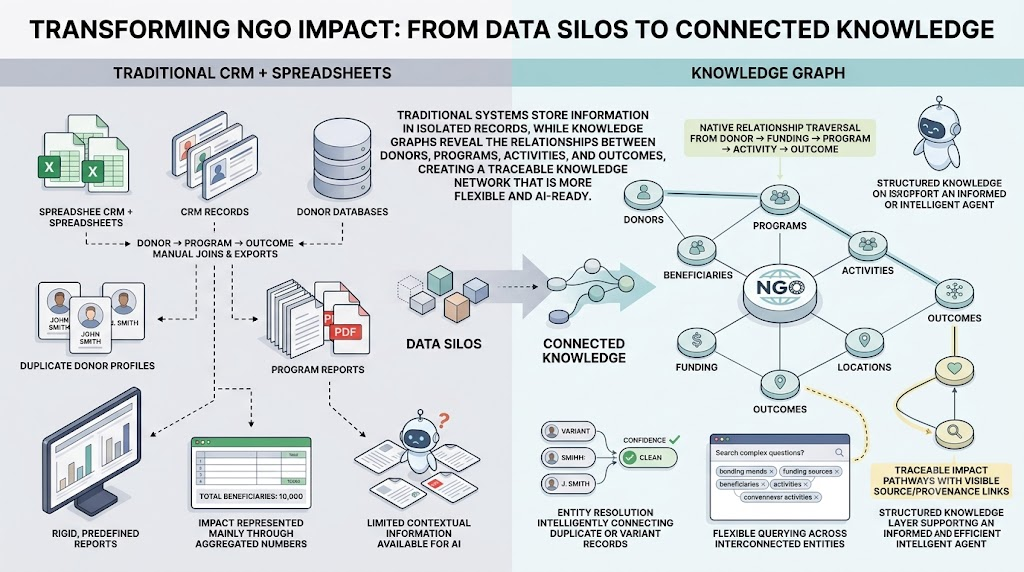
Entity resolution is especially hard. The same person may appear as “Margaret Chen,” “M. Chen,” or under a spouse’s name across different gift records and meeting notes. Traditional databases struggle with these fuzzy matches.
Knowledge graphs handle them by modeling relationships and confidence scores rather than forcing every record into a rigid table.

What a knowledge graph actually does for programs, donors, and outcomes
A knowledge graph stores information as nodes (entities) and edges (relationships). A donor node links to gifts, which link to funded programs, which link to locations, beneficiaries, and measured outcomes.
Those outcomes can further connect to Sustainable Development Goal targets or sector indicators. Once the structure exists, the system can answer questions such as:
- Which donors have funded work that improved a specific outcome in a given region?
- Which programs share beneficiaries or partners and might be coordinated?
- What is the full journey from a multi-year grant to the indicators reported to the foundation?
Projects that map nonprofit activities to the UN Sustainable Development Goals have already demonstrated this approach, creating semantic pathways from local indicators up to global targets. Similar architectures are being applied to donor entity resolution and impact data integration.
The practical payoff is clearer attribution stories for donors, faster compliance reporting, and the ability to spot gaps or overlaps that spreadsheets hide.
Practical benefits and early patterns
Organizations that have experimented with graph approaches report several recurring gains. Gift officers can ask natural-language questions about a donor’s history and receive answers grounded in the underlying records.
Program teams can see which interventions correlate with stronger outcomes without exporting and joining multiple files. Leadership gains a more complete picture of portfolio performance.
The technology also supports better AI use. When an NGO later adds retrieval-augmented generation or agentic tools, a knowledge graph supplies structured context that reduces hallucinations and improves explainability. That combination is becoming central to enterprise AI strategies in 2026.


Comparison of traditional systems versus graph approaches
Growth of the underlying technology
The broader knowledge-graph market is expanding rapidly as organizations seek AI-ready data foundations. Industry forecasts place the market in the multi-billion-dollar range by the early 2030s, with strong compound annual growth rates driven by the need for context, relationships, and explainable AI.
Semantic layers and knowledge graphs are moving from experimental projects into mainstream infrastructure for agentic systems. While most published growth figures focus on enterprise sectors, the same architectural advantages apply to the complex, multi-stakeholder data environments of NGOs.

Interesting Fact Box
- Many NGOs still spend significant staff time reconciling data across systems, sometimes estimated at 15-20% of certain roles, simply to produce donor or board reports.
- Knowledge graphs excel at entity resolution for weakly identified records, a common challenge in donor databases where names, emails, and notes vary.
- Projects linking nonprofit indicators to the UN Sustainable Development Goals have used graph structures to make collective impact more visible. Sources: Sector analyses of post-award grant management and published knowledge-graph applications in social-impact domains..
Practical takeaway
Start small. Identify one high-value question that currently requires hours of manual work, perhaps linking a cohort of major donors to a set of program outcomes and model the relevant entities and relationships. Use existing CRM and M&E exports as the first data sources.
Prove the query works, then expand. The goal is not a perfect enterprise graph on day one; it is a living map that grows with the organization’s learning needs.
At AddWeb Solution we help mission-driven organizations design practical knowledge-graph foundations that connect the people who give, the programs that deliver, and the outcomes that matter. When those connections become queryable, both accountability and insight improve.
Connect Your NGO’s Data With Intelligent Knowledge Graphs

Pooja Upadhyay
Director Of People Operations & Client Relations
Source URLs:
https://www.utupub.fi/bitstreams/72586e06-90d5-4502-85bd-7dbce233c281/download
https://www.marketsandmarketsblog.com/knowledge-graph-market-set-to-hit-9-88-billion-by-2032.html
https://www.researchandmarkets.com/reports/6068244/knowledge-graph-global-strategic-business-report
