


Overview
Today’s AI systems are not just a model script executing on a local computer but an entire end-to-end pipeline that feeds dirty input data into the model in order to produce accurate predictions in production in real-time.
In the process of implementing an AI pipeline, you will be developing a chain of steps aimed at transforming your data into valuable predictions. This includes collecting data, preparing it, building the model, deploying it, and monitoring its performance.
Python has become the defacto language for developing pipelines due to rich sets of libraries providing tools for data engineering, machine learning modeling, deploying the models, and applying MLOps techniques.
This article is about the key elements of such a pipeline, explained in clear business terms and with an emphasis on their functionality, responsibilities, and Python involvement in the process.
Big-picture view of an AI pipeline
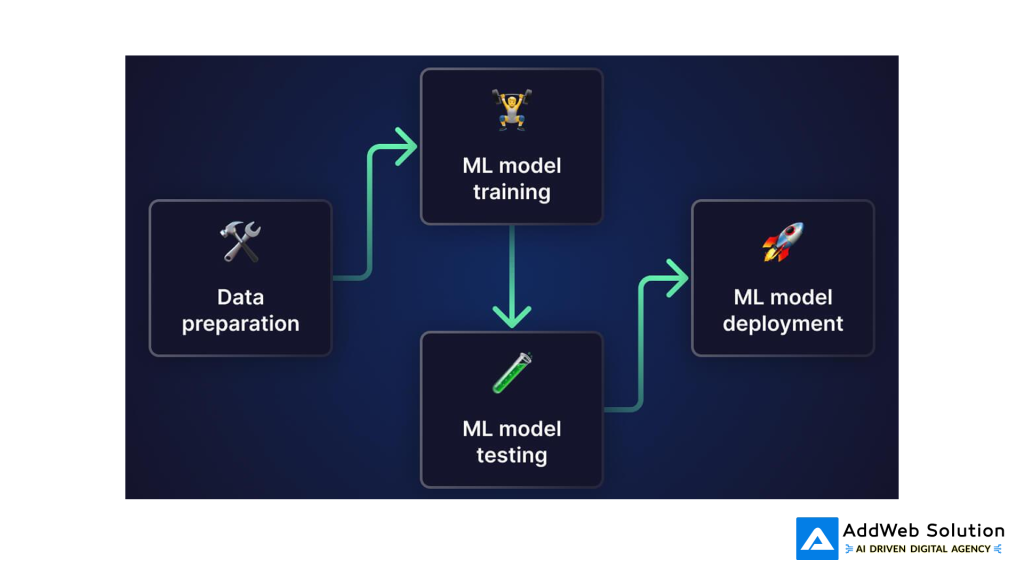
Machine Learning Pipeline Flowchart
From an overview perspective, most production pipelines have a common pipeline structure:
- Business problem definition & performance measurement
- Data collection & storage
- Data cleaning & preprocessing
- Feature engineering & selection
- Model building & validation
- Deployment to a production environment
- Monitoring performance & iterating
IBM, major cloud services, and MLOps platforms outline these stages with somewhat different nomenclature.
This article will provide detailed information on each step along with code snippets in Python and visual illustrations that can be used in your blog posts.
Why do pipelines matter (particularly for Python teams)?
An AI pipeline is not just a visual representation but the collaboration tool between data scientists, engineers, and business folks without constantly messing with each other’s job.
In Cloud MLOps best practices, it states that production systems require pipelines that are automated and reproducible instead of notebooks in which models are trained, deployed, and monitored consistently.
For Python teams, the right pipeline will:
- Lessen glue coding by automating tasks such as data transformation, feature engineering, and scoring.
- Be reproducible as the same scripts are run each time with proper versioning.
- Ensure seamless handoffs since data engineers deal with data pipelines, ML engineers with model training and deployment, and SRE or platforms engineers with the infrastructure itself.
- Enable continuous processes including integration, delivery, training, and monitoring (i.e., continuous X).
Otherwise, a good model will get stuck inside a notebook or suffer decay in the wild as the world evolves.
The core stages at a glance
A practical way to think about an AI pipeline is as seven linked stages.
Stages and responsibilities
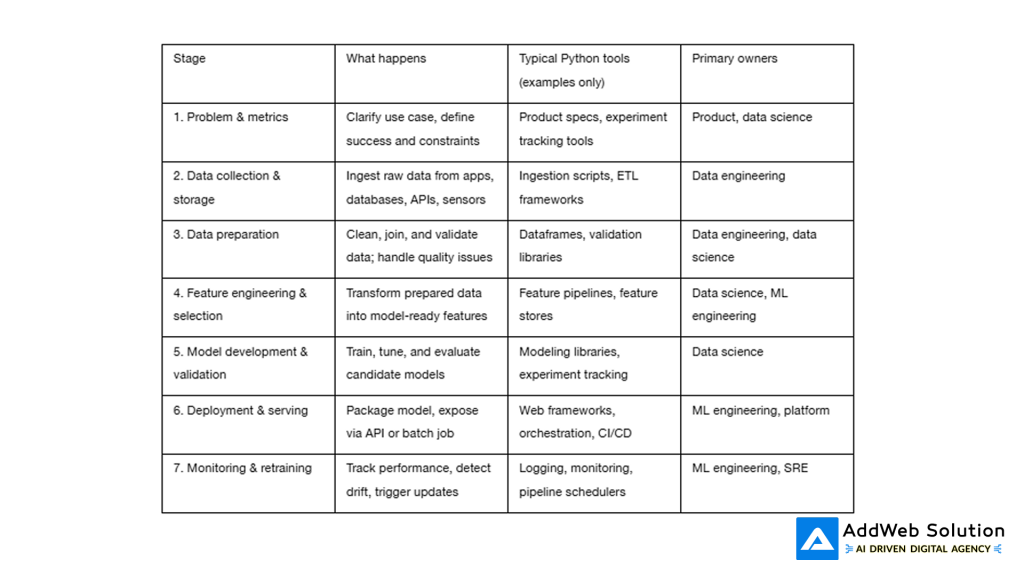
This structure broadly matches how major vendors describe the machine learning lifecycle: data processing, model development, deployment, and ongoing monitoring and governance.
Stage 1: Frame the problem and success metrics
An effective AI workflow begins long before coding.
The industry guidelines suggest that there should be a clear definition of the business question, the decision that the AI is going to automate, its success metrics, and constraints, including fairness considerations and regulation.
Effective framing addresses such questions as:
- What decision will this model make (loan approval, ticket routing, lead prioritization)?
- What would be considered good performance numerically (increase in conversion rate, reduction in handling time, decrease in false positives)?
- What are the no-go zones (e.g., any prohibited attributes on which predictions cannot be based)?
- In what format will the predictions be delivered (through the dashboard, API, integration into a product workflow)?
It ensures that the workflow will optimize the right objective and establishes reasonable expectations of the capabilities of the AI solution.
Stage 2: Collect and store raw data
Once the problem statement has been formulated, focus moves to the data.
The literature on machine learning states that data manipulation begins with source selection and data intake from operational systems, logs, APIs, third-party suppliers, or sensor inputs.
Common considerations include:
- What systems produce the events/behaviour to be understood by the machine learning model?
- What are the arrival rates of the data – streaming data or batched data?
- What type of storage is appropriate for analytics/model training – data warehouses, lakehouse or object storage?
- What level of security, privacy and access control is needed?
Proposed visualization: Pie chart with source data distribution
For making the discussion of this topic more interesting in a blog post:
- Pie chart of proportion of volume of data by source, e.g.,
- product usage events
- CRM/marketing data.
- Enrichment from third parties
- Annotations manually added or feedback
- Consider using this graphic to demonstrate that production models frequently use more than one source of information instead of just one nicely formatted table.
Your numbers should be based on your specific organization, but it’s meant to illustrate the variety of sources.


Step 3: Prepare the data for analysis
Raw data is rarely ever ready to be fed into the model.
Best practice guides emphasize that data preparation—the process of collecting, cleaning, analyzing, and transforming the data into usable features—is often the most time-consuming step in the entire pipeline, but also has the greatest effect on the quality of the final model.
Preparing the data involves:
- Cleaning: correcting errors, addressing duplicates, handling missing information, and filtering out outliers.
- Transformation: standardizing formats, parsing dates, encoding text, and filtering noise.
- Integration: combining tables from separate databases, matching schemas, and harmonizing business keys.
- Splitting: building training, validation, and test datasets with appropriate time or group boundaries.
Python teams usually spend a lot of time here with their data scientists and data engineers working together on transformations that will be used multiple times, not just hacks in a single notebook.
Suggested visual: Bar chart of time spent per stage
A simple bar graph is able to demonstrate that significantly more work will be devoted to data preparation than to any subsequent modeling phase.
For authenticity and readability purposes, name the bars such as “Data gathering & preparation”, “Feature engineering”, “Model training”, and “Deployment and monitoring” rather than using exact percentages, as the picture (the height of a single bar) says everything.
Step 4: Feature engineering and selection
Features represent what the model gets to see.
Machine learning pipelines described in industry speak put special emphasis on the importance of converting columns to useful features, which is no less important than selecting an algorithm.
Popular feature engineering practices include the following:
- Ratio, aggregation, or trend calculation features (like purchase rate or rolling mean).
- Categorical encoding into numeric values.
- Text/image embedding generation through already trained models.
- Using domain knowledge to construct features connected to business logic.
Selection is carried out to filter out unnecessary information and leave only the most informative one.
Suggested visual: Feature importance graph
In a blog, a horizontal bar chart effectively presents the feature importance of a sample model.
Feature names should be anonymized or illustrated by examples (“Tenure”, “Recent activity”, “Support tickets in last 30 days”) and bars sorted in descending order of importance, thereby illustrating the principle of non-equal contribution of input variables.
Stage 5: Model development and validation in Python
Having prepared the data and features, the team moves to the modeling phase.
References on this topic state the model selection, training, optimization, and evaluation, conducted in an experimental cycle.
More concretely, this step includes:
- The selection of model families according to the problem nature (e.g., gradient boosting for tabular data, deep learning for image recognition, linear algorithms when interpretability is crucial).
- Conducting of systematic experiments with named, metricized, and versioned models, ensuring replicable results.
- Validation of the model performance on a held-out dataset using appropriate evaluation metrics (e.g., precision–recall score for rare-event classification, calibration error for risk scoring).
- Consideration of trade-offs between different model qualities – a lower accuracy but higher interpretability model could be preferred in some circumstances.
All of that can be scripted and automated in the context of a full-fledged pipeline using Python tools.
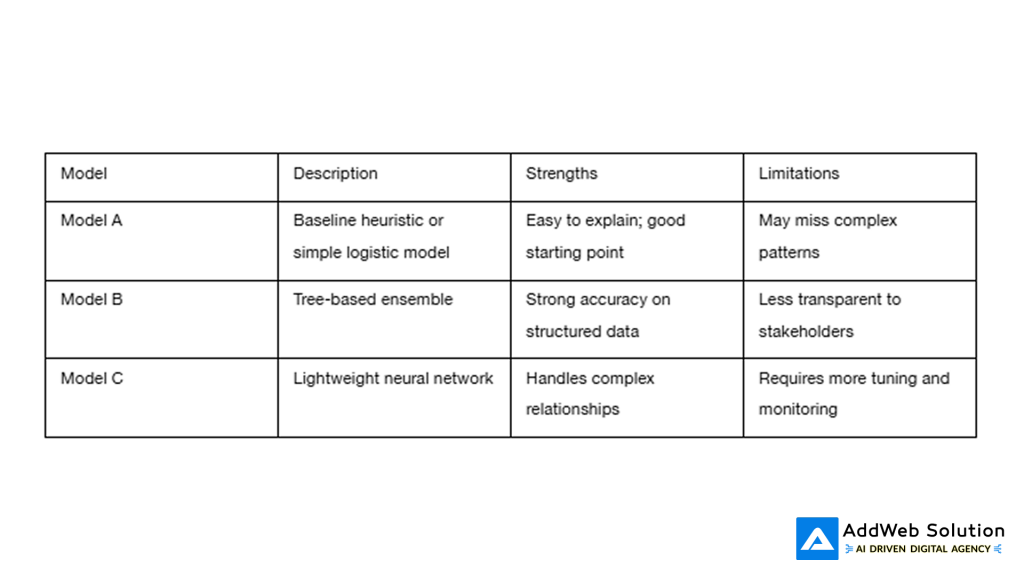
Suggested visual: Model comparison table
Include a table in your blog that compares a few illustrative model candidates.
You do not need to reveal production numbers; even relative metrics can help the reader understand trade‑offs.
Stage 6: Deploy the model and serve predictions
A model is only valuable when it can be used reliably by downstream systems and users.
Cloud MLOps documentation distinguishes between training pipelines that create new model versions and serving pipelines that expose models for real‑time or batch predictions.
Key deployment decisions include:
- Serving pattern: real‑time API for interactive products versus scheduled batch scoring for reports or campaigns.
- Infrastructure: on‑premises versus cloud; containerised microservices versus serverless functions.
- Interfaces: standardising how downstream applications send inputs and receive predictions.
- Observability: logging inputs, outputs, and latencies so issues can be debugged after the fact.
Python fits naturally here because the same model objects used in training can be wrapped in lightweight web services or batch jobs, reducing translation errors between languages.
Suggested visual: Deployment flow diagram
Use a simple left‑to‑right diagram that shows:
- Incoming requests from applications or data pipelines.
- A “Model service” box that loads the trained model and applies it.
- Outputs flowing to a database, message queue, or user interface.
This helps non‑technical readers see how a model becomes a live component in the product architecture.
Stage 7: Monitor, retrain, and govern
The final stage is continuous rather than one‑off.
MLOps literature stresses that production models must be monitored for performance, fairness, stability, and operational health; retraining and rollbacks should be triggered based on clear signals rather than panic.
Effective monitoring typically covers:
- Prediction quality: tracking metrics such as accuracy, precision, recall, calibration, or business KPIs over time.
- Data drift and concept drift: detecting changes in input distributions or relationships between inputs and targets so models can be retrained or adjusted.
- Operational metrics: latency, error rates, throughput, and resource usage (for example, memory, GPU utilisation).
- Compliance and lineage: recording which model version was used, who approved it, and how it was evaluated before deployment.
Suggested visual: Performance-over-time line graph
To make this concrete in a blog:
- Plot a line graph of a key performance metric (for example, validation accuracy or a business outcome like conversion rate) over several months.
- Mark retraining events on the timeline to show how metrics recover after a new model version is deployed.
This makes the idea of “continuous monitoring” immediately understandable to both technical and non‑technical readers.
Bringing it together: How Python glues the pipeline
While each stage can use different tools or platforms, Python provides a common thread through the entire pipeline.
Vendors and open‑source projects increasingly expose Python SDKs for data processing, training, deployment, experiment tracking, and pipeline orchestration, which helps teams standardise workflow definitions and reuse components.
In a healthy production setup, the pipeline feels less like a collection of scripts and more like a living system:
- New data flows in through scheduled or streaming jobs.
- Training pipelines periodically create and evaluate new model versions.
- Serving pipelines roll out new models safely, often using techniques like blue‑green or canary deployments.
- Monitoring processes watch for drift or regressions and raise alerts when action is needed.
Python’s role is to serve as the connective tissue across these activities so that teams spend more time on problem solving and less on glue code.
Practical checklist for designing your AI pipeline in Python
To close, here is a practical, non‑technical checklist you can adapt for your own organisation:
- Clarify the decision and success metrics before touching data.
- List all data sources and agree on a reliable, governed path into your analytical storage.
- Invest in a robust, reusable data preparation layer; resist “quick fixes” in notebooks.
- Design feature engineering as shareable components, ideally stored in a feature store for reuse.
- Treat model development as an experiment pipeline with clear naming, metrics, and versioning.
- Decide early how predictions will be consumed: API, batch file, dashboard, or product feature.
- Build a minimal but reliable deployment pipeline before chasing exotic model architectures.[8][2]
- Define monitoring KPIs for both model performance and system reliability and wire them into your observability tools.
- Plan for retraining triggers (time‑based, data‑drift‑based, or performance‑based) instead of waiting for stakeholders to complain.
- Document everything as you go so new team members can understand and safely evolve the pipeline.
Designing an AI pipeline is less about one “perfect” architecture and more about creating a clear, repeatable path from raw data to trustworthy predictions.
With Python at the centre and a thoughtful focus on each stage, teams can deliver models that not only perform well in experiments but also stand up to the messy, changing realities of production.
Ready to build scalable AI pipelines for your business? Connect with our Experts to design production-ready machine learning systems tailored to your workflows.

Pooja Upadhyay
Director Of People Operations & Client Relations
References
- https://developers.google.com/machine-learning/crash-course/production-ml-systems/ml-pipelines
- https://www.ibm.com/topics/machine-learning-pipeline
- https://cloud.google.com/architecture/mlops-continuous-delivery-and-automation-pipelines-in-machine-learning
- https://learn.microsoft.com/en-us/azure/machine-learning/concept-model-management-and-deployment
- https://spark.apache.org/docs/latest/ml-pipeline.html
- https://cloud.google.com/discover/what-is-mlops
- https://neptune.ai/blog/mlops-principles
- https://developers.google.com/machine-learning/guides/rules-of-ml
