


Executive summary
From being “nice to have” perks, workplace wellness has evolved into a hard business metric linked with stress, absenteeism, turnover, and productivity. As organizations begin to measure various employee health signals in real-time, Laravel can serve as a pragmatic approach for developing wellness tracking applications that are secure, flexible, and highly integrated with existing HR technology infrastructures.
This report will cover the rationale for wellness tracking, a discussion on what “employee health signals” look like in terms of implementation, and a walkthrough of a real-world architecture for tracking those signals in Laravel, including sample charts, tables, and interface ideas you can copy and paste into your product/engineering briefs.
Why workplace wellness tracking matters
Furthermore, global data continues to show that work-related stress is at record or near-record highs. More recently, Gallup data has shown that nearly half of American and Canadian employees are experiencing work-related stress on a daily basis. High stress levels have a direct impact on burnout, disengagement, and turnover. These are all areas that have a direct impact on team performance and employer brand. To HR and operations leaders, wellbeing is no longer a soft issue but a quantified business risk.
Conversely, there are now significant data points on the financial impact of formalized wellness programs. Meta-analysis studies have shown that formalized wellness programs can decrease absenteeism by 14 to 25 percent and can save as many as 1.5 to 1.8 sick days per employee per year. There have also been several studies showing average returns on investment for these types of programs range between three to six units of value for every unit of cost when both healthcare and absenteeism are included.
Historically, most organizations have measured wellness at coarse intervals through annual surveys or occasional health screenings. Wellness tracking applications change that by turning wellbeing into a continuous signal rather than a yearly snapshot. When implemented carefully, this allows earlier intervention, better targeting of benefits spend, and more honest conversations between managers, HR, and employees.
From wellness programs to health signals
What are “employee health signals”?
Employee health signals are observable, privacy‑respecting indicators that collectively describe the physical, mental, and social wellbeing of the workforce. Examples include:
- Self‑reported mood, stress, and energy scores from short check‑ins.
- Participation and completion rates in wellness activities (steps challenges, mindfulness sessions, coaching calls).
- Work pattern indicators such as chronic late‑night logins, long meeting hours, or frequent context switching.
- HR data such as sick days, unplanned absences, and turnover intentions.
- Optional, consent‑based integrations with wearables or health apps (heart rate variability, sleep duration, resting heart rate).
Individually, each signal is noisy. Collectively, they form a time‑series view of wellbeing at the individual, team, and organizational levels. A Laravel application is well suited to orchestrate the ingestion, storage, analysis, and presentation of these signals.
Why real‑time and continuous?
Traditional annual engagement or wellness surveys give a backward‑looking, highly averaged view of sentiment. By contrast, continuous signals:
- Surface micro‑trends early (for example, sustained stress in one team over three weeks).
- Reveal the impact of specific interventions (launching a new hybrid policy or manager training cohort).
- Allow more precise ROI estimation for wellness spend by linking changes in signals to absenteeism and retention outcomes.[7][2]
The shift from static to continuous data is what makes architecture and implementation questions so important—and where Laravel’s strengths emerge.
Why Laravel is a strong fit for wellness tracking
Laravel brings a combination of developer productivity and enterprise‑grade patterns that fits wellness tracking use cases particularly well:
- Rich ecosystem: Native support for authentication, authorization, queues, events, task scheduling, and API development shortens time‑to‑value.
- Modular architecture: Wellness platforms can be decomposed into bounded contexts (surveys, device data, analytics, reporting) implemented as Laravel modules or separate services.
- First‑class API support: Laravel’s HTTP resources, API resources, and Sanctum/Passport make it straightforward to expose REST or JSON:API endpoints to mobile apps, wearables, and third‑party tools.
- Queues and async processing: Worker queues (via Redis, SQS, or similar) are ideal for processing incoming health events, computing scores, and updating dashboards without blocking user interactions.
- Scheduling and automation: The built‑in task scheduler is perfect for daily nudges, weekly digests, or batch analytics jobs on wellness data.
- Mature ecosystem for observability and security: Established patterns for logging, rate limiting, encryption, and auditing are essential when handling sensitive wellbeing information.
For teams already invested in Laravel for internal tools or customer‑facing products, extending the stack to wellness is often more efficient than introducing a completely new technology.
High‑level system architecture in Laravel
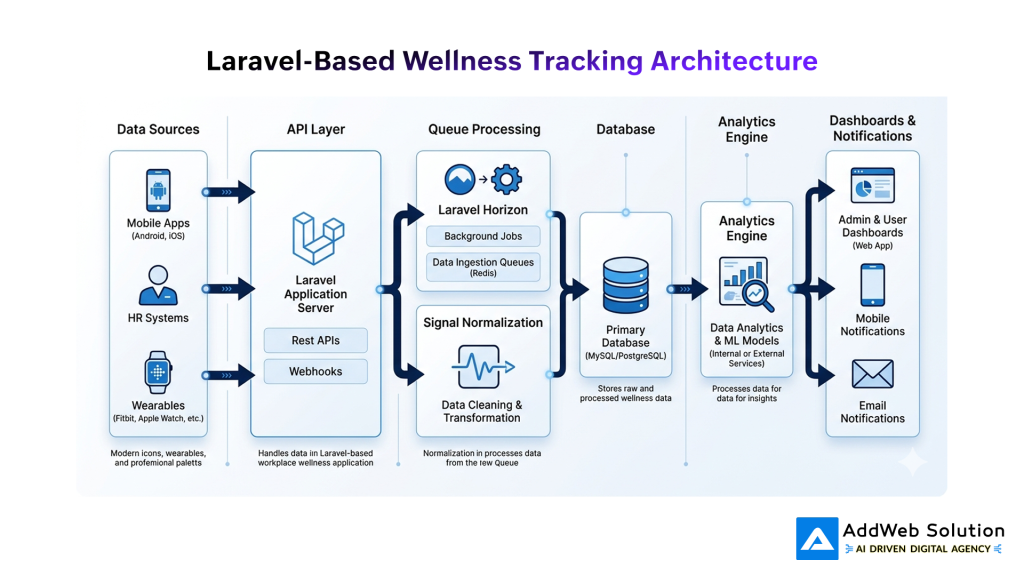
A typical wellness tracking application in Laravel can be organized into several layers:
- Data sources
- Web and mobile apps for self‑reported mood, energy, focus, and feedback.
- HRIS and payroll systems providing absence, schedule, and employment data.
- Collaboration tools (calendars, messaging, meeting analytics) providing workload and meeting load signals.
- Optional integrations with wearables or third‑party wellness providers.
- Ingestion and integration layer
- REST and webhook endpoints implemented as Laravel controllers for receiving events.
- Jobs queued for downstream processing (validation, enrichment, normalization).
- Integration classes per provider (for example, FitbitClient, GoogleWorkspaceClient).
- Data storage and modeling
- Relational tables for employees, teams, and organizational structure.
- Time‑series tables for signals, for example wellness_signals with columns such as employee_id, signal_type, value, unit, recorded_at.
- Aggregation tables or materialized views for daily, weekly, and monthly roll‑ups.
- Optional data lake or warehouse integration for heavier analytics.
- Analytics and scoring layer
- Laravel jobs or scheduled commands computing wellbeing indices (for example, “burnout risk score” or “engagement risk score”).
- Rules engines or simple configuration‑driven thresholds for alerts (for example, “if stress score > 4 for three consecutive days, flag for HR review”).
- Application and visualization layer
- Dashboards for HR, leadership, and managers.
- Employee‑facing views summarizing personal trends and recommended actions.
- Exports and APIs for BI tools.
A simplified architecture diagram in text form:
Key employee health signals and how to model them
Example signal model table
Below is a practical way to think about common health signals and their representation in a Laravel application.
| Signal type | Example source | Data model idea (Laravel) | Typical business question |
| Stress level | Daily 1–5 self‑rating in mobile app | WellnessSignal with type = ‘stress’, integer value, timestamp | Which teams show sustained high stress? |
| Mood / affect | Emoji‑based quick check‑ins | Enum or small integer mapped to mood categories | Are mood scores dropping after org changes? |
| Sleep duration | Wearable integration | Decimal hours with source = ‘wearable’ | Are chronic short‑sleepers at higher risk? |
| Physical activity | Steps or active minutes | Aggregated per day from raw events | How does activity relate to sick days? |
| Meeting load | Calendar analytics | Daily meeting minutes, number of meetings | Who is in back‑to‑back meetings most days? |
| Focus time | Time without meetings or chat activity | Derived from calendar and collaboration APIs | Are focus hours eroding in critical teams? |
| Sick leave | HRIS absence records | Absence records linked to employees and absence reasons | How do wellness scores correlate with sick leave? |
| Burnout risk score | Composite from multiple indicators | Pre‑computed score stored in employee_metrics table | Who needs proactive outreach? |
This pattern—one flexible signal table plus a few summary tables—keeps the schema adaptable as new health signals are added over time.
Using Laravel to protect privacy and trust
Wellness tracking only works if employees trust that data will be used ethically, anonymized appropriately, and kept secure. Evidence from wellbeing programs shows that utilization and impact drop sharply when employees fear that participation may be used against them in performance or promotion decisions.
Laravel offers several building blocks for a privacy‑preserving design:
- Role‑based access control (RBAC): Policies and gates restrict access so that individual‑level data is visible only to authorized roles (for example, the employee and a small clinical or people operations team), while managers see only aggregated, anonymized views.
- Row‑level scoping: Query scopes ensure that managers can see only their own teams’ data at the level of aggregation allowed by policy.
- Encryption at rest: Laravel supports encryption for sensitive columns (for example, free‑text journal entries or clinical notes) using built‑in encryption helpers.
- Audit trails: Activity logs track who accessed which records and when—critical in regulated contexts.
A clear privacy model, articulated in product copy and employee handbooks, should accompany the technical controls.
Example visualizations for wellness tracking
A Laravel application can expose data both through server‑rendered Blade views and through APIs consumed by frontend frameworks. The following examples illustrate visualizations that can be implemented using charting libraries such as Chart.js, Highcharts, or Laravel‑compatible wrapper packages.
Pie chart: share of employees reporting high daily stress
Gallup’s global workplace research and subsequent analyses show that roughly 41–49 percent of workers in North America report experiencing work‑related stress on a daily basis, depending on the year and specific survey. A simple pie chart can make this split explicit for a given organization.
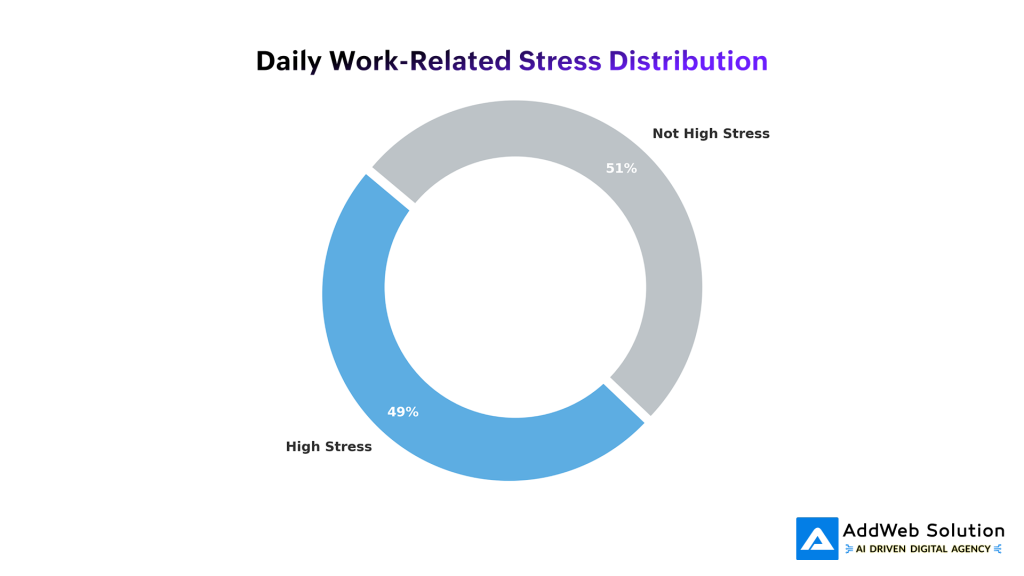
In a Laravel app, this pie chart would typically be backed by a query that counts the number of unique employees whose last daily check‑in exceeded a chosen stress threshold.
Bar graph: absenteeism index before and after wellness program
Reviews of workplace wellness programs suggest absenteeism reductions in the order of 14–25 percent when initiatives are well designed and adopted. One common way to visualize this without exposing raw cost figures is to use an indexed bar chart.
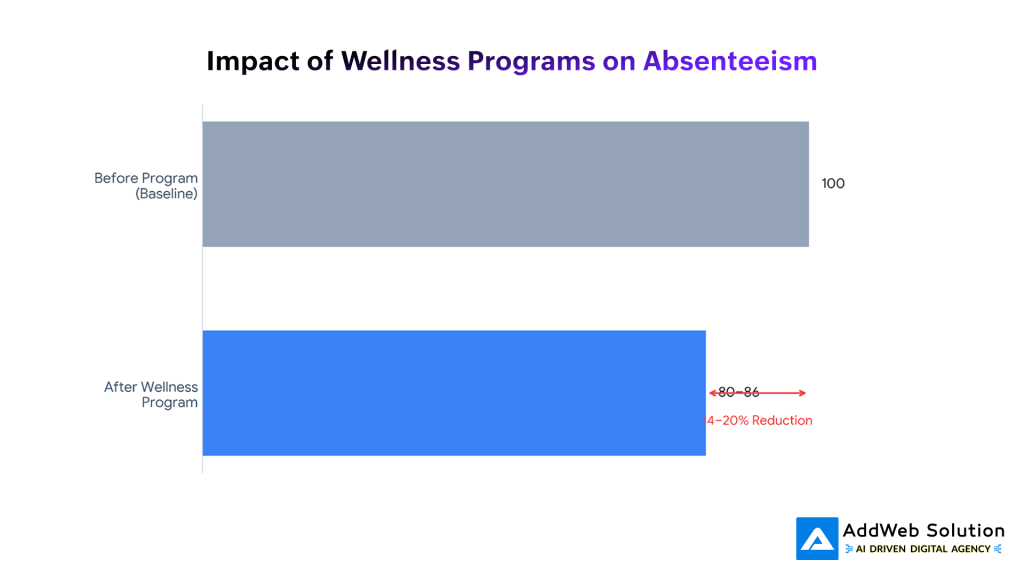
Laravel can compute this index by comparing total absence‑related costs (or days lost) across comparable periods before and after implementation, then returning pre‑computed values to the frontend.
Sample tables for dashboards and reports
Manager dashboard metrics
The table below illustrates metrics that a Laravel‑powered manager dashboard might surface weekly. Values would be computed in scheduled jobs and cached for performance.
| Metric | Definition | Example insight |
| Average stress score | Mean daily stress rating (1–5) over last 2 weeks | Team stress is rising week‑over‑week. |
| High‑stress prevalence | Share of team with stress score ≥ 4 | A third of the team is in high stress for multiple days. |
| Average sleep duration (if enabled) | Mean nightly hours of sleep over last 14 days | Sleep debt is building in specific roles. |
| Wellness program participation | Percent of team joining at least one wellness activity | Low participation suggests communication or access issues. |
| Absence rate | Sick days per FTE over last quarter | Absence is trending down after new mental health initiatives. |
| Burnout risk index | Composite indicator from multiple signals | Helps prioritize outreach and workload rebalancing. |
HR and leadership reporting
At the HR and executive level, aggregated tables help connect wellness to business outcomes, using ranges documented in the research literature.
| Outcome metric | Typical impact range with effective programs | Source range (illustrative) |
| Reduction in absenteeism | 14–25 percent | Reviews and multi‑study analyses |
| Sick days saved per employee / yr | 1.5–1.8 days | Employer case studies and survey data |
| Wellness ROI (combined benefits) | 3–6 units of value per unit of cost | Health promotion and corporate wellness ROI |
| Revenue per employee improvement | Around 11 percent in high‑performing firms | Studies of firms with mature wellness efforts |
These ranges are drawn from published studies and meta‑analyses rather than invented benchmarks; actual organizational outcomes will vary by design, participation, and baseline context.
Implementation patterns in Laravel
Data modeling and Eloquent patterns
A practical strategy is to keep the data model intentionally generic so that new signals can be added without repeated migrations. For example:
- employees and teams tables define the organizational graph.
- wellness_signals stores time‑stamped observations with columns such as employee_id, type, value, unit, source, and recorded_at.
- employee_metrics stores pre‑computed rolling metrics like 7‑day average stress or 30‑day activity score.
- absences stores absence episodes with dates and reasons.
Laravel’s Eloquent ORM can express rich relationships and scopes on top of this schema, for example:
- Scopes for fetching recent signals (->recent()), specific types (->ofType(‘stress’)), or ranges.
- Accessors that normalize values (for example, converting steps to activity points).
- Observers that trigger jobs when new data is saved (for example, recalculating a burnout index when new signals arrive).
Queues, events, and real‑time updates
Wellness tracking lends itself to asynchronous processing because signals arrive continuously and need aggregation:
- Event broadcasting: When a new signal is created, a WellnessSignalRecorded event can be fired, with listeners updating aggregates or sending notifications.
- Queued jobs: Heavy computations (such as recomputing team‑level indices) should run in background jobs dispatched to a queue.
- WebSockets or polling: Dashboards can subscribe to updates via Laravel Echo and a WebSocket server, or rely on periodic polling of pre‑aggregated metrics.
This pattern decouples data ingestion from visualization, keeping the user interface responsive even under heavy load.


Integrations with wearables and third‑party platforms
Many organizations already subsidize or encourage use of consumer wellness apps. Laravel’s HTTP client and job queues make it straightforward to:
- Pull summarized data via provider APIs on a schedule.
- Normalize provider‑specific payloads into a common wellness_signals format.
- Respect per‑employee consent settings by scoping which sources and data types are ingested.
Each integration can be encapsulated in a separate service class and scheduled command, simplifying testing and future maintenance.
Human‑centered product choices
Even the best technical implementation fails if it feels intrusive or punitive. Research on program effectiveness and adoption emphasizes the importance of perceived support and autonomy. Practical, human‑centered design choices include:
- Opt‑in, transparent data use: Clear explanations of what is tracked, why it is tracked, and who can see what.
- Focus on trends, not single days: Dashboards should emphasize patterns over time and de‑emphasize one‑off bad days.
- Support, not surveillance: Copy and interaction design should frame wellness tools as resources employees control, not monitoring tools imposed from above.
- Actionable recommendations: Pair charts with concrete suggestions—coaching sessions, content, ergonomics checks, or workload discussions.
- Inclusive design: Ensure features support desk and frontline workers, parents, caregivers, and people with chronic conditions rather than assuming a narrow persona.
Laravel does not solve these design questions, but it does provide the flexibility to tailor experiences per role, geography, and policy.
Putting it together: a Laravel wellness tracking roadmap
For organizations considering a Laravel application to monitor employee health signals, a pragmatic roadmap might look like this:
- Discovery and alignment
- Clarify goals: reduce absenteeism, improve engagement, support mental health, or all of the above.
- Map existing data sources and constraints (HRIS, collaboration tools, local regulations).
- MVP definition
- Start with two or three high‑value signals (for example, daily stress check‑ins and sick leave) and simple composite indices.
- Implement role‑appropriate dashboards for employees and managers.
- Technical foundation in Laravel
- Set up the base Laravel project with authentication, RBAC, logging, and encryption.
- Implement core models, migrations, queues, and first ingestion endpoints.
- Pilot and iteration
- Run a pilot with a subset of teams; collect qualitative feedback alongside quantitative outcomes.
- Refine questions, thresholds, and visualizations based on employee input.
- Scale and integrate
- Add more data sources (wearables, EAP utilization, learning platforms) as consent and value justify.
- Integrate with BI tools and leadership reporting to link wellness to business metrics.
By combining robust Laravel engineering with a careful approach to privacy, communication, and behavior change, organizations can move beyond annual wellness surveys to continuous, humane insight into how people are really doing at work.
Get a tailored Laravel solution for your workforce analytics needs.

Pooja Upadhyay
Director Of People Operations & Client Relations
References
- https://www.gallup.com/workplace/349484/state-of-the-global-workplace.aspx
- https://www.gallup.com/workplace/236441/employee-engagement-drives-growth.aspx
- https://pmc.ncbi.nlm.nih.gov/articles/PMC5372129/
- https://www.ajhp.org/doi/10.4278/ajhp.26.1.TAHP
- https://www.wellsteps.com/blog/2019/01/02/corporate-wellness-programs-roi/
- https://www.cdc.gov/workplacehealthpromotion/index.html
- https://www.who.int/news-room/fact-sheets/detail/mental-health-at-work
- https://www.ncbi.nlm.nih.gov/pmc/articles/PMC6974702/
